Background
Climate change and the Earth’s current habitable state is one of the most important and controversial topics in today’s global economy. Earth climate change studies also refer to studies of planets like Mars, Venus, and even Titan as the evolution of climate at these solar system bodies at some point diverged from what occurred and is occurring at Earth. Climate processes are explored with general circulation models. These models trace the balance of planetary energy resources relative to five distinct reference frames:
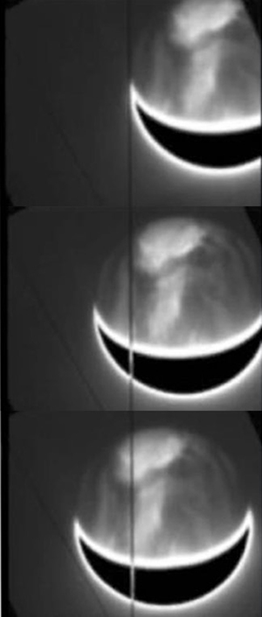
Figure 1: Series of SpeX CCD guide camera images taken over a 15-minute period in parallel with PRISM (0.8-2.5 µm) spectral observations. The PRISM (0.8-2.5 µm) spectra are obtained using the SpeX 3x60 arsec2 slit. The CCD guide images record the brightness of Venus’s full disk near 1.74 µm and the intersection of the SpeX slit with the disk of Venus. In this image series, the intersection of the SpeX slit with Venus moves from the north pole of Venus (top image) inward towards Venus’s equator (bottom image). The full disk of Venus would have been scanned (i.e., moving from the north to south pole) on this date within the SpeX slit after an additional 15 to 20 minutes.
Planetary latitude
Longitude
Altitude
Time of day relative to the sun’s position above the observed location
The passage of time on timescales of minutes, hours, and years
Empirically (i.e., observationally) derived 2D and 3D maps of the temporal evolution of Venus radiative properties are in high demand for the development and validation of Venus climate model simulations.
Approach
For two decades, SwRI has sustained a program of Venus observations at near-infrared wavelengths using the NASA/IRTF (Infrared Telescope Facility) /SpeX instrument, obtaining PRISM mode spectra within the SpeX slit coincidently with guide camera images. In PRISM mode, SpeX records a spectrum in each spatial pixel position at the resolution of the spectrograph. These data record the temporal evolution of Venus atmospheric radiation as a function of latitude, longitude, and time between observations and would be ideal for the validation of model-based studies of the impact of various radiative processes such as nightglow emissions, thermal radiation of the clouds and surface, and the absorption of that radiation by atmospheric gases on Venus’s climate evolution.
To ensure that high-fidelity 2D brightness maps may be derived from the SpeX data, SwRI has created a library of computation analysis tools that may be used to assign the absolute image brightness, the absolute wavelength calibration, and the on-disk spatial locations for each pixel within the SpeX slit. Code to search for and correct both systematic and non-systematic deviations in the observed brightness levels from mean brightness levels and/or from the anticipated pixel-to-pixel brightness gradients was written and tested. Code producing a forward model of Earth’s atmospheric transmission calculator which allows the user to confirm the wavelength assignment of each spatial pixel based on the expected location of known telluric features and calibrate the absolute brightness of the observations was written and tested. Additionally, a suite of codes that identifies Venus’s disk center within the SpeX guide CCD camera images and then maps the spatial location of each spectral pixel in the SpeX slit relative to Venus’s disk center (as observed in the guide CCD camera) has also been generated. These codes enable accurate latitude and longitude assignment to each spatial pixel. After application of the complete library of tools to the individual spectral scans, those scans can then be combined to create 2D maps of Venus’s brightness at any wavelength.
Accomplishments
SwRI has created, validated, and archived a library of seven automated and interactive numerical codes not currently available in the IRTF-provided SpeX data analysis cookbook. These tools allow the efficient conversion of the SpeX data into high-fidelity 2D maps of Venus’s radiative properties. These computational codes have been publicly archived on the GitHub site, VENIM. High-fidelity 2D maps of Venus’s 1.27 µm nightglow emission were presented at the 2021 Division of Planetary Science meeting as a demonstration of the effectiveness of the codes.
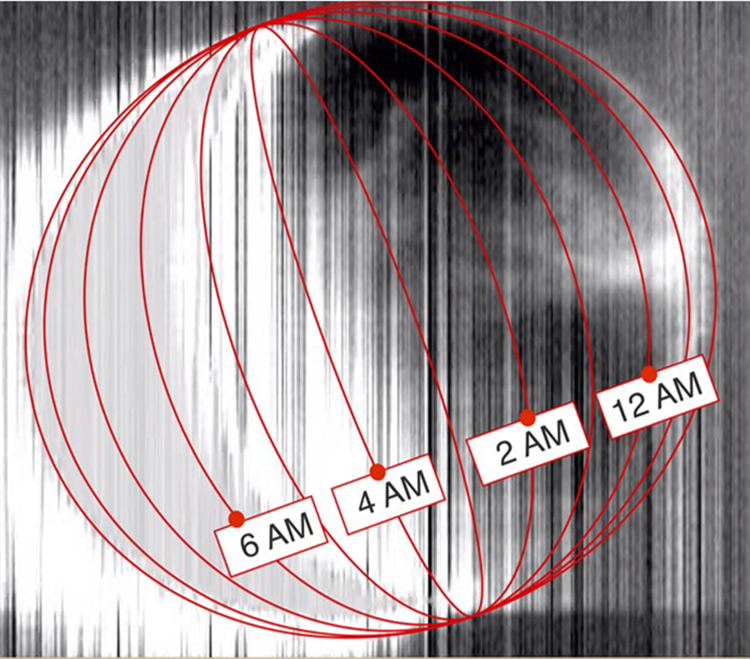
Figure 2: 2D spatial map of Venus’s 1.27 µm nightglow emissions. This map is produced by combining the individual SpeX/PRISM spectral scans observed in the 3x60 arcsec2 slit at 1.27 µm.
2D maps made from PRISM spectral scans are superior to maps inferred from broad filter imaging because the brightness patterns can be mapped at the spectral resolution of the spectrograph. This is game changing because Venus’s radiance (thermal brightness) is sensitive to cloud particle size distribution, particle abundance, and gas composition, each of which will produce unique wavelength variant radiance signatures. In the absence of wavelength resolution (i.e., broad filter imaging), the relative significance of each of these factors becomes muddled.