
In the early 1900s, finding new reservoirs of water and oil was more an art than a science. “Wildcatters” — including the father of Southwest Research Institute’s founder, Tom Slick Jr. — roamed the country prospecting for oil, drilling exploration wells in unproven oil fields. Once known as “Dry Hole Slick” after a string of bad luck when at least 10 exploratory wells came up dry, Tom Slick Sr. discovered Oklahoma’s giant Cushing oil field in 1912 and then became known as the “King of the Wildcatters.” The initial well produced for the next 35 years. SwRI is now using modern digital techniques to improve the accuracy and efficiency of geological data collection and analysis. These data-driven approaches allow SwRI scientists to make quantitative predictions about the subsurface.
For the past 30 years, SwRI has taken some of the gamble out of resource exploration and development, offering quantitative structural geology and geomechanics services to help clients better understand the complex interplay between subsurface structures, rock properties and fluid flow. Our research, consulting and training services benefit not only oil and gas exploration, but also geothermal exploration, groundwater management and geological storage and disposal of waste materials.
Recently, SwRI began integrating unmanned aerial vehicles (UAVs), or drones, with modern digital photogrammetry and automated feature detection to improve our understanding of subsurface geology. By precisely aligning aerial imagery, structural geologists can use high-resolution 3D reconstructions to extract geological information from surface rock exposures, or outcrops. These data provide detailed information about the geometrical properties of fault and fracture networks, which can be used to predict geological structures in analogous settings underground. This work allows scientists to quantitatively predict how faults and fractures affect subsurface fluid flow and storage. These predictions are important for a range of industries, including geothermal energy, carbon dioxide sequestration, oil and gas extraction, groundwater management, geological storage or disposal of hazardous waste and even planetary exploration.
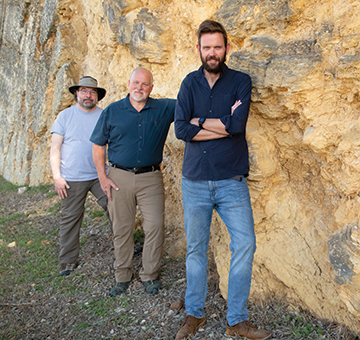
ABOUT THE AUTHORS
From left: Dr. Kevin Smart manages SwRI’s Earth Science Section, offering extensive expertise in computational solid mechanics, structural geology and geomechanics, field mapping and geologic fracture analysis. Dr. David Ferrill is an Institute scientist with international research experience in characterizing reservoirs and aquifers, interpreting tectonic stress and analyzing rock deformation and fracture mechanisms. Dr. Adam Cawood is a structural geologist specializing in the use of close-range remote sensing techniques for structural analysis, particularly using digital photogrammetry to reconstruct outcrops for geological analysis. Cawood is also a founding member and lead curator of eRock, an open-source repository of digital outcrops for teaching, research and science communication.
Photogrammetry: Beginnings
Map makers first used photogrammetry, or the process of using overlapping imagery, to extract 3D measurements, in the 1850s when cartographers used photographs taken from church steeples to map the neighborhoods of Paris. Since then, photogrammetry has been used to generate detailed topographic maps across the Earth’s surface and even reconstruct the surface topographies of Mars and Venus.
Over the course of the 150 years between the invention of photogrammetry and the dawn of the 21st century, the process of using photographs to acquire elevation data remained essentially unchanged. The manual identification of common points in overlapping images was used to calculate the elevation of photographed objects. While incremental improvements in photogrammetric equipment and techniques allowed measurements to be collected more efficiently and accurately, manually identifying objects in photographs remained the norm. This labor-intensive process was eventually superseded in the 1960s and 1970s by other distance measuring systems such as Light Detection And Ranging (LiDAR).
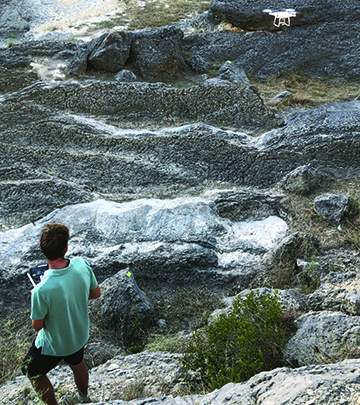
SwRI’s Dr. Adam Cawood collects UAV imagery of surface rock exposures with precise GPS data to build high-resolution, accurate “digital outcrops” for geological data extraction.
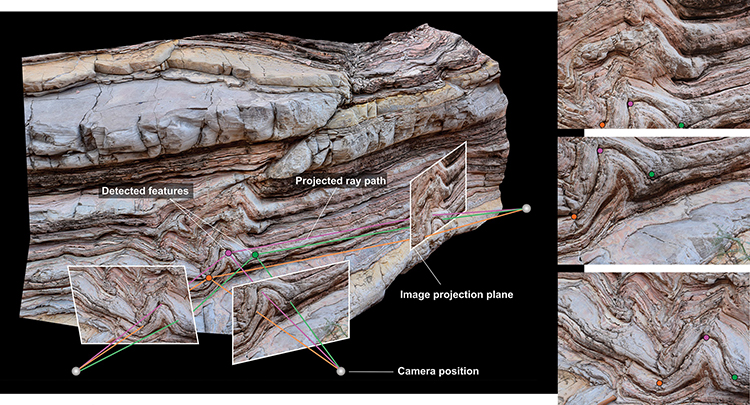
Digital photogrammetry uses pixel searching algorithms to locate common points or features in multiple overlapping images.
Going Digital
Widespread adoption of digital photography and the associated development of computer vision techniques have revolutionized photogrammetry over the past decade. Automated pixel searching and matching algorithms have replaced manual point picking in traditional photogrammetry, making the process more efficient and more flexible than traditional approaches. Conventional photogrammetry uses pairs of images and relies on precise knowledge of camera positions and lens distortion parameters. In contrast, digital photogrammetry can automatically generate 3D models from hundreds to thousands of digital photographs in unordered image collections without requiring precise geospatial data or prior optical information. Today’s modern digital photogrammetry can rapidly reconstruct 3D scenes with minimal user input, has a flexible approach to image alignment and does not rely on specialized knowledge or expensive equipment.
DETAIL
Compass clinometers are used to measure the 3D orientation of geological surfaces such as faults, fractures or bedding surfaces.
In parallel with advances in digital photogrammetry, the past decade has seen a revolution in commercially available UAV technology. Relatively low-cost drones can be outfitted with high-resolution digital cameras for close-range remote sensing. Because aerial imagery can be collected rapidly, efficiently and at low cost, scientists, engineers and surveyors can digitally reconstruct 3D scenes with unprecedented speed and efficiency. Today, UAVs and digital photogrammetry are used in a range of applications, from agriculture and infrastructure monitoring to flood and natural hazard risk management.
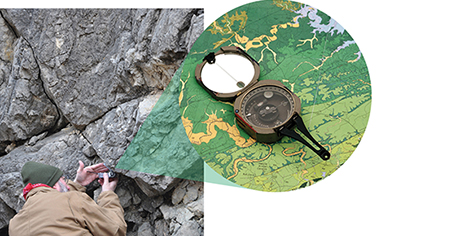
SwRI geologist Dr. Kevin Smart uses a compass clinometer to measure fault orientations by hand.
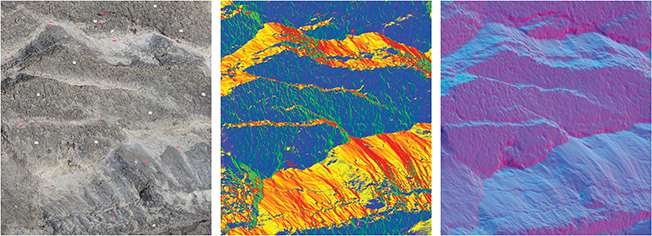
High-resolution 3D data and data visualization techniques provide insights into fault and fracture network properties. Scientists apply false colors based on outcrop surface orientations to highlight fault geometries and the complexity of small-scale fault networks, which appear as warm colors (yellow to red) in middle image and blue in image at right.
Digital Geology
The study of outcrops is critical to understanding geological processes and helping geoscientists accurately predict subsurface geological features. SwRI structural geologists have been studying fault and fracture networks at outcrops for several decades, determining that the geometric properties of these networks can strongly influence fluid flow pathways and distribution below ground.
Field geologists traditionally measure outcrop faults and fractures using manual techniques and handheld instruments, with tools such as compass clinometers, tape measures and field notebooks. SwRI is improving the efficiency and reliability of geological data collection using digital photogrammetry techniques. With UAV photography and precise GPS measurements, the team can generate high-resolution, accurately scaled and precisely oriented digital outcrops to extract reliable digital measurements. This approach does not negate the need for traditional geological fieldwork but rather expands the field geologist’s toolbox. Field measurements and observations remain critical for benchmarking digital data and for providing in-depth knowledge of geological processes.
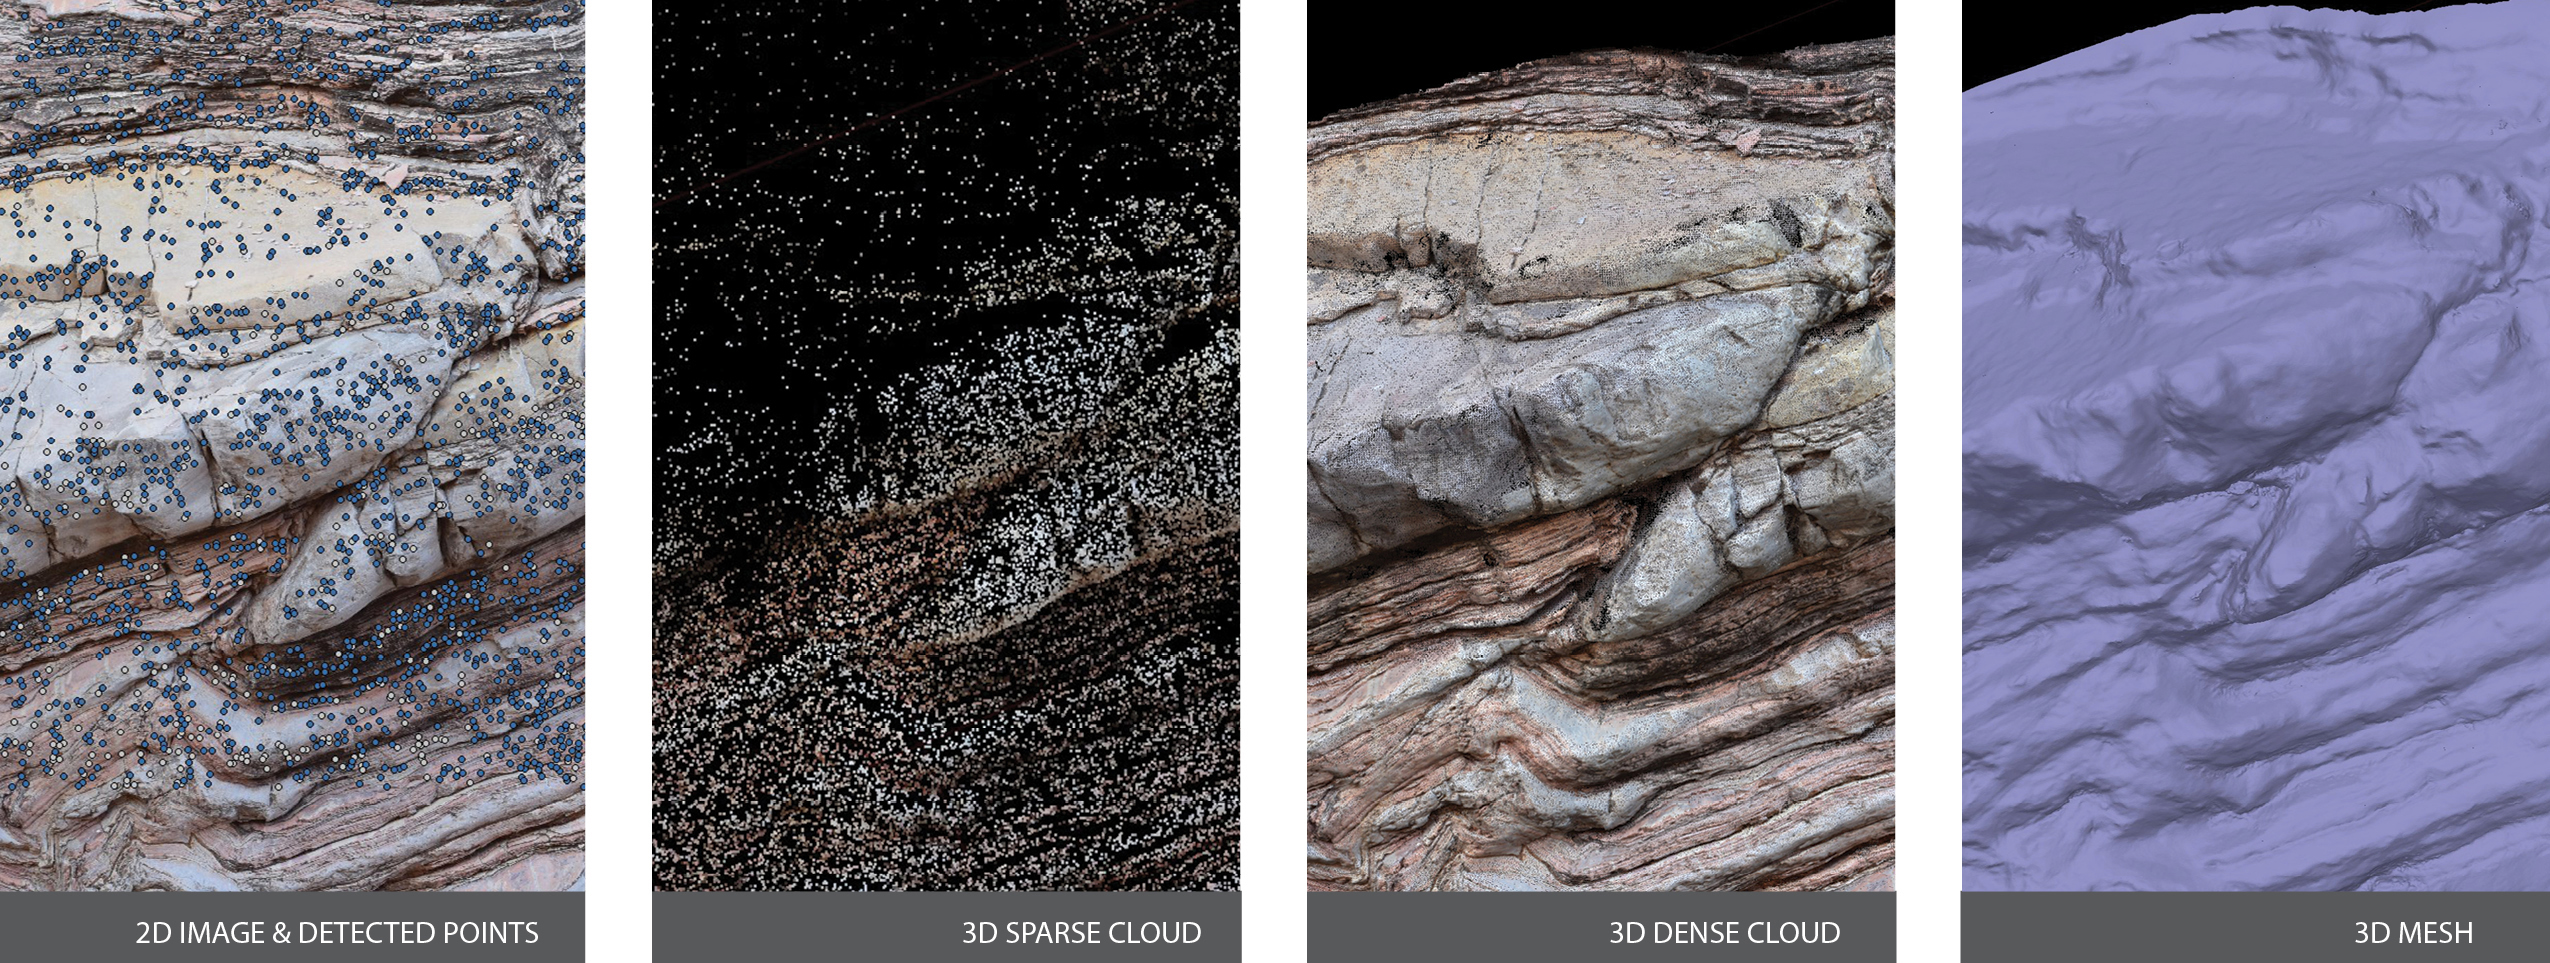
Features or objects in 2D images are automatically detected and aligned using computer vision algorithms. This process converts 2D images into 3D geometric information that can be used for geological analysis.
From Digital Outcrop to Geological Data
SwRI’s digital outcrop models allow large datasets to be extracted more efficiently, safely and cost-effectively than traditional fieldwork. These 3D reconstructions can contain hundreds of millions of data points, providing a wealth of geological information. Geostatistical predictions typically rely on large datasets, and digital outcrops have the potential to meet this need. Translating these rich datasets into geological understanding or valid predictions in the subsurface, however, remains a challenge.
DETAIL
A digital outcrop model is a 3D representation of a geologic outcrop surface, either as a textured polygon mesh or as a 3D point cloud.
The current approach to extracting geological measurements from digital outcrops involves time-consuming hand digitizing of geological features, where a geologist traces faults and fractures in a digital 3D environment. While this is generally faster than field-based fault or fracture mapping, it still requires a significant amount of user input. SwRI scientists are using computer vision techniques such as edge detection algorithms and computer-assisted interpretation workflows to address this challenge. Early results are showing promise and have improved the efficiency of digital data extraction. By developing digital data extraction workflows that are both robust and more efficient than existing approaches, SwRI is fully leveraging recent developments in digital photogrammetry and UAV technology to develop a data-driven approach to geological modeling.
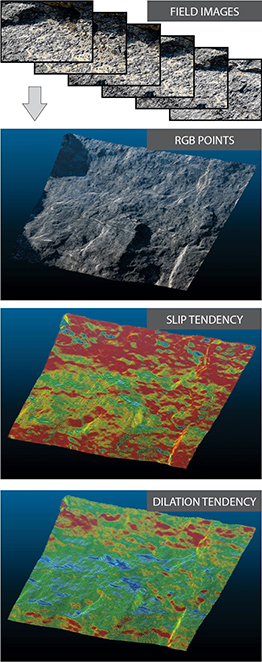
Outcrop images are used to generate a 3D point cloud and mesh of an exposed fault surface. SwRI analyzed the reconstructed fault surface with its 3DStress® software to understand fault initiation and growth, and the implications for fluid flow along fault surfaces in the subsurface.

Looking at outcrops in the Canyon Lake Gorge, SwRI geologists tested the accuracy of digital photogrammetry against existing laser scan data. This comparison map shows the differences between laser scan and digital photogrammetry data at a test location and highlights the improved coverage and accuracy provided by aerial imagery and photogrammetric reconstruction.
Data-Driven Predictions
In the traditional approach to using outcrops as analogs for the subsurface, a geologist makes outcrop observations and measurements to infer geological conditions or rock properties underground. While this approach has proved invaluable for conceptual understanding of the subsurface, limitations of traditional fieldwork mean that robust statistical predictions are not always possible. With improved digital sampling abilities — such as sampling at a range of observation scales and at regular intervals — SwRI is now able to apply data-driven approaches to understanding and predicting subsurface fault and fracture properties. This capability is equally applicable to traditionally accessible outcrops and outcrops that are generally inaccessible due to vertical or overhanging outcrop surfaces or unstable rock. By performing multivariate statistical analysis on compiled geological variables, SwRI scientists aim to improve the understanding of how multiple geological factors combine to influence the formation of faults and fractures.
DETAIL
Multivariate statistical analysis addresses multiple statistical outcome variables at a time, addressing multiple measurements and their relationships to explore data structures and patterns.
SwRI is developing a suite of quantitative relationships between combined geological properties and the properties of fault and fracture networks. SwRI is combining digital measurements of fault and fracture properties — such as fracture lengths, orientations and abundance — with other geological variables — such as mechanical properties, layer geometry and thickness, and rock type, mineralogy and porosity. Geologists then combine these data with properties that are readily measurable or available from subsurface data such as wellbore information and seismic images to make probabilistic predictions of fault and fracture properties at depth. These results will provide the foundation for understanding and predicting complex fault and fracture properties in a range of geological settings.
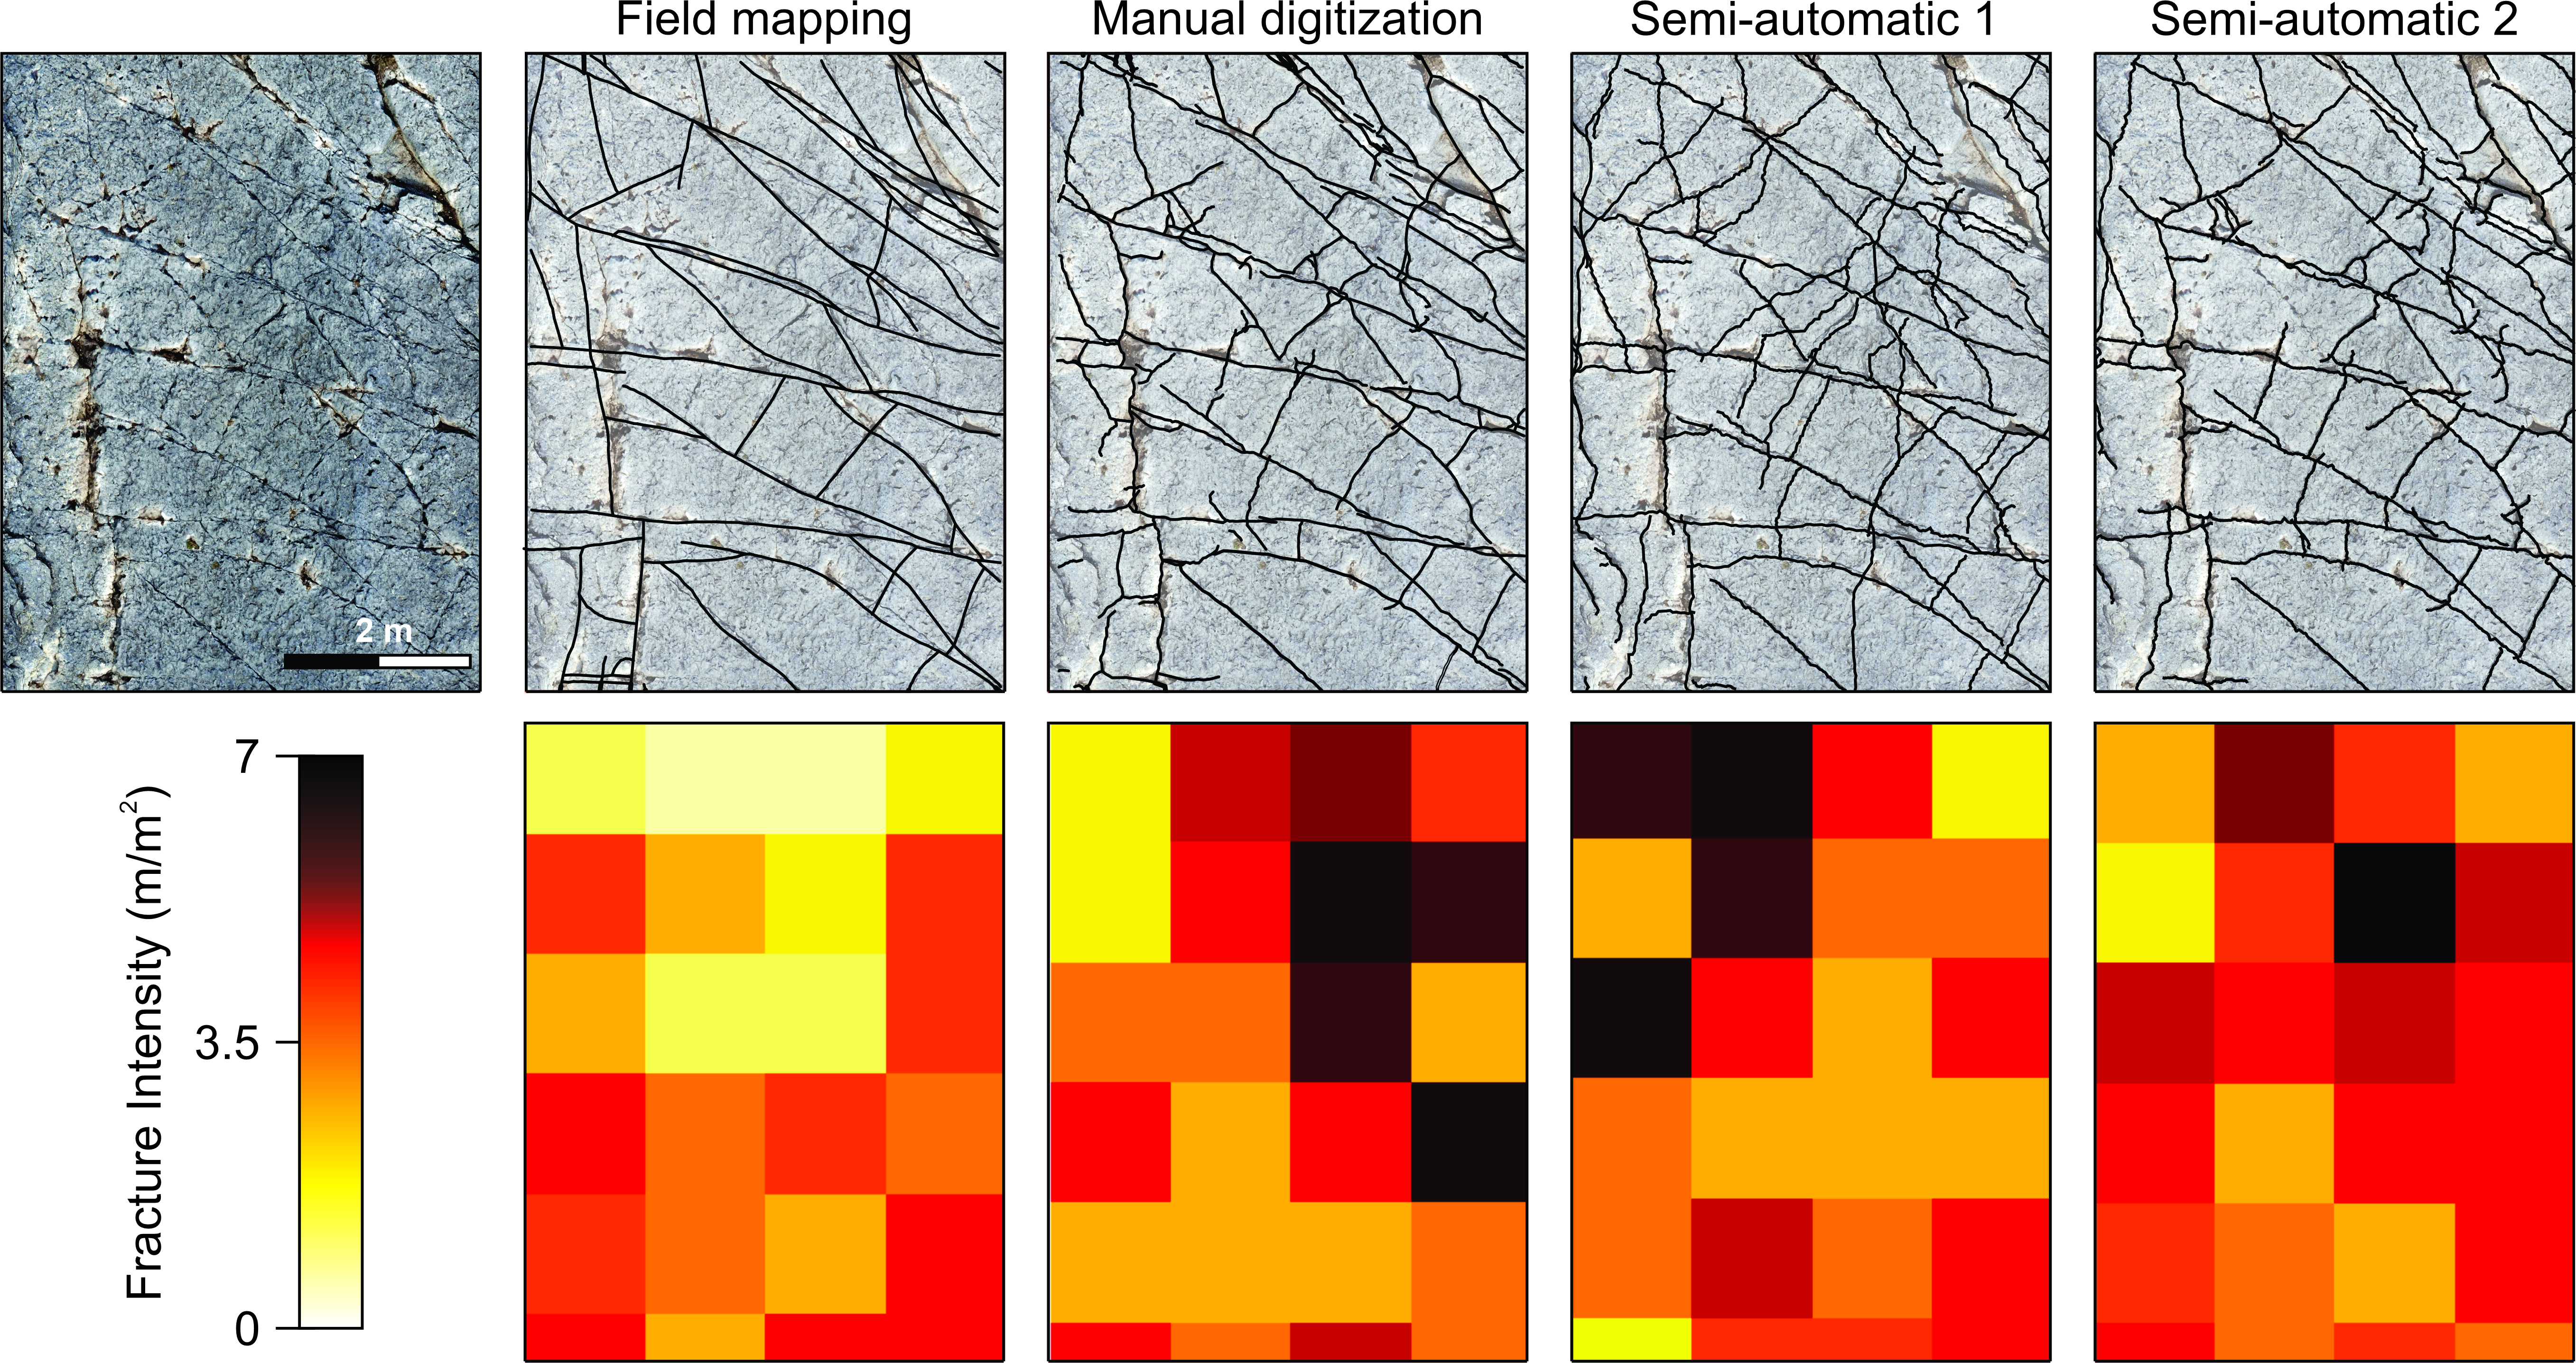
SwRI geologists use field-based fracture maps to investigate the efficiency and accuracy of digital methods. Semi-automatic approaches yield higher detail fracture maps in a fraction of the time taken to map fractures manually.
Future Directions
Currently, SwRI geologists are focused on both methodological approaches to digital data extraction, and more broadly, on predicting fault and fracture network properties below ground. This work is important because these geological structures play a significant role in how fluid moves through subsurface rock. While current methods for extracting oil and gas from reservoirs rely on understanding the properties of subsurface faults and fractures, these factors will remain important as the world transitions to alternative energy sources such as geothermal resources. Effective extraction of geothermal energy relies on understanding faults and fractures and how those features influence fluid circulation pathways underground.
The growing global population is intensifying pressures on natural resources. The imperative to meet global targets for reducing greenhouse gas emissions means that carbon dioxide sequestration and effective groundwater management will become increasingly important in the future. As with many subsurface applications, understanding and predicting the mechanisms for the flow and retention of fluids in rock formations are critical for managing our aquifers and for safe, effective long-term underground storage of carbon dioxide.
Improved understanding of the subsurface will help ensure that current and future energy needs are met, groundwater resources are managed sustainably and contaminants and waste products can be safely isolated underground. As SwRI digital photogrammetry technology advances, it will improve our understanding of what controls fault and fracture properties and allow geoscientists to make better predictions of subsurface properties. Predicting what lies beneath has the potential to improve operations for a range of critical applications.
Questions about this story or Geological Services? Contact Adam Cawood at +1 210 522 3958.