Background
Managing water resources in arid and semi-arid dryland landscapes is increasingly important due to pressures from escalating water demand, limited water availability, and uncertainty resulting from global climate change. Groundwater is an important component of available water resources, and appropriate resource management requires that replenishment through recharge be accurately determined. In drylands, the available soil moisture storage in upland areas, with steep slopes and thin soils, is a critical factor that strongly influences when and how much water runs off and becomes available for focused recharge in adjacent channels and streambeds.
Soil moisture is extremely difficult to measure in upland areas at watershed scales. Satellite based data sources promise to help fill this gap, such as data from the Soil Moisture Active Passive (SMAP) and the Cyclone Global Navigation Satellite System (CYGNSS) missions. SMAP and CYGNSS sense radar (L band) signals that are naturally emitted (SMAP) or reflected (CYGNSS) from the Earth’s surface. Like aboveground radar interferometry, these wavelengths are sensitive to soil moisture in the shallow subsurface (<5 cm). The SMAP products have fundamental resolutions of 1 to 15 km and have been the subject of extensive validation and calibration work, primarily in flat lying areas with relatively deep soil where both insolation load and instrument observation bias are uniform across the landscape. Such data already are finding use for calibration of land surface models.
Given the critical importance and difficulty in accurately calculating dryland recharge, this research seeks to develop and assess techniques that use newly available satellite sensed data to improve recharge estimates by reducing uncertainty in soil moisture. The research focuses on upland areas that are critical to dryland recharge where there are technical challenges and uncertainties associated with sensing moisture changes in rugged topography that have remained unstudied.
Approach
The project has two separate but related tasks: (i) analysis of the data gathered by satellite based sensors for upland topography to better understand the limitations and opportunities offered by the data and (ii) development of methodologies to use the satellite sensed data to constrain recharge calculations. The first task considers arid and semiarid North America, especially the southwestern United States, and may lead to improved interpretation of the data or improvements in future Earth-observing satellite missions. The second task will use the satellite data to advance understanding and effective management of critical groundwater resources, focusing more specifically on west Texas.
The first task includes acquiring representative sensor data for the study area, then evaluating the data for information content, biases, and consistency with complementary data sets. The SMAP, CYGNSS, and Geostationary Operational Environmental Satellite (GOES) satellite platforms were initially identified as providing data that are or can be used to constrain ground-surface moisture conditions. These satellite data are at a coarse scale relative to the watershed topography, so one approach is to use fine‑scale data and topography to better estimate what the sensors are reporting in rough topography. The first task also assesses potential additional or replacement satellite data sources, as well as assessing methodologies for acquiring and manipulating the large quantities of satellite data.
The second task is to translate improved soil moisture estimates into improved recharge calculations. Several candidate approaches have been identified as potentially suitable for refinement or calibration with the satellite data, ranging from simple empirical models to more‑detailed land surface models. As the characteristics of the satellite data are identified, appropriate models will be assessed. An existing surface water/groundwater model for a west Texas basin will be used to provide a testbed for comparison of recharge calculations.
Accomplishments
The project team identified two additional candidate radar‑based satellite data sources early in the project. The Soil Moisture and Ocean Salinity (SMOS) dataset has L‑band emittance data, similar to SMAP data and with similar resolution, but obtained with a different observation strategy over a much longer historical period. The Sentinel-1 dataset is based on polarized backscatter from C-band radar and has approximately 10-m grid resolution. The Sentinel-1 images resolve small features, such as hillslopes, fields, and rivers, that cannot be resolved in SMAP, SMOS, and CYGNSS data, which represent averages over several kilometers, but have shallower soil penetration depths and are more sensitive to above‑ground moisture stored in vegetation and snow. The fine spatial resolution in Sentinel‑1 data is useful for exploring the consequences of landscape topography and land use.
The project team selected the Google Earth Engine (GEE) (see https://earthengine.google.com/) as a primary analysis tool during the early stages of the project. GEE includes (i) a large and growing database of publicly available data; (ii) a powerful Application Programming Interface permitting exploratory analyses, including visualization using the Google Maps platform; and (iii) a server farm that performs image processing in parallel. The GEE database includes 402 raster data collections, in the general categories of (i) satellite‑based imagery, (ii) geophysical (e.g., terrain, land cover, and surface temperature), (iii) climate and weather (e.g., atmospheric data, weather datasets, and climate model predictions), and (iv) demographic data, as well as various vector data collections, such as political boundaries and roads. The imaging interface overlays the images onto the Google Maps background at the full range of available scales, allowing images from different collections or observation times to be directly compared, merged, and manipulated. The GEE platform automatically partitions analysis tasks onto multiple servers in parallel by tiling the images, and provides a variety of methods for filtering and reducing the data collections and performing geospatial analysis. The GEE platform provides strong capabilities for land surface classification using single or multiple data streams.
The GEE platform has the significant advantage that no data product in the GEE database needs be acquired, stored, and georectified prior to analysis. The GEE database includes the Sentinel‑1 image collection, but does not directly include the SMAP, SMOS, CYGNSS, and GOES datasets. The GEE database does include derivative products for both SMAP and SMOS data, including (i) soil moisture at a 0.25 degree resolution based on external model analyses with data assimilation, and (ii) soil moisture anomaly. The GEE database includes optical/infrared images derived from the Landsat (30 m resolution), MODIS (250 to 1000 m resolution), and Sentinel‑2 (10 to 40 m resolution) platforms. Optical and infrared images are essential for complementary analyses of vegetation and surface water dynamics used to interpret radar‑based signals.
With the availability of the high-resolution Sentinel‑1 dataset in the GEE platform, the project team is focused on analyses combining Sentinel‑1 data, optical/infrared images, daily gridded weather databases, and site‑specific data, to understand and quantify land‑surface responses. The team has performed a series of analyses using the Sentinel‑1 data in the Interferometric Wide Swath mode, which consists of the radar backscatter in the VV and VH polarizations. The Sentinel‑1 raw radar reflectance is strongly correlated to the sensor look angle (i.e., azimuth and elevation) relative to the hillslope aspect, with much stronger reflectance when the hillslope is facing the sensor, and each image includes substantial speckle that is much larger than the average backscatter response to changing moisture state. The team developed processing protocols for despeckling a time series of images while preserving topographic and land surface features.
Project work has confirmed that Sentinel-1 data show distinct patterns due to seasonal vegetation growth overlaid with responses due to soil moisture increases from rainfall events, ground freezing, snow, and surface roughness changes (e.g., agricultural plowing). Observed changes in radar backscatter are larger with low vegetation cover and significant soil thickness than in highly vegetated areas or bare rock. The team is developing indices based on the Sentinel‑1 data to differentiate vegetation responses from soil responses, and is in the process of testing the indices at a variety of locations across Texas using weather data, soil moisture sensor data, and optical/infrared satellite data (Landsat and Sentinel‑2).
Figure 1 illustrates how one index, the difference between VV and VH backscatter (in dB), depends on local topography and landscape properties. This index is sensitive to changes in vegetation moisture, but also responds to changes in soil moisture. The figure shows the difference between the maximum and minimum index value over four years. The half crop circle has a larger range in signal than outcrop areas and the dense native vegetation, because soil moisture responses to precipitation are not obscured during precipitation and because of the growth of crops. The dry creek also has a large range, responding to runoff events, as do buildings and dirt roads.
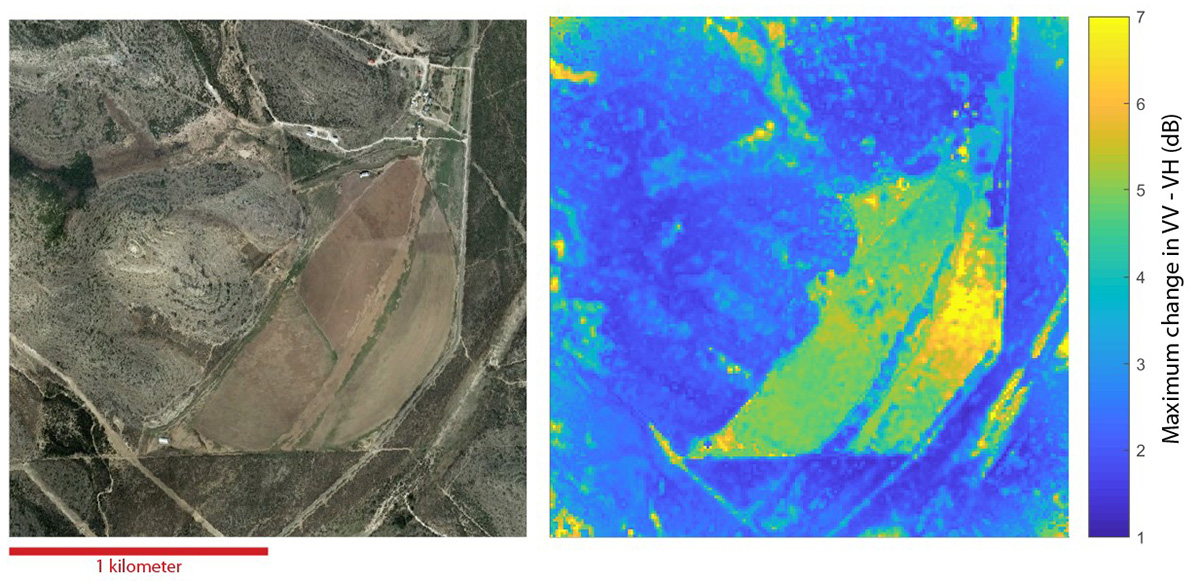
Figure 1: Visual image and range of a radar backscatter index observed in the upper Devils River watershed, Val Verde County, TX, using 109 Sentinel 1 relative orbit 78 (ascending path) images from 3/16/15 through 3/13/19. The index is the ratio of VV s to VH s, expressed as dB, where s is the polarized backscatter coefficient. One dB is 10 log10(s); the ratio of VV to VH backscatter coefficients changes by factor of four over the scale range. Irrigated areas and topographic low points have a larger index. The optical image is from Google Earth.
The project team is focusing on locations where two or more Sentinel‑1 swaths overlap, allowing cross comparison between different look angles and different times of day for data acquisition. Primary investigation is considering responses along the precipitation gradient from approximately San Antonio to Marfa, taking advantage of overlapping swaths where available (e.g., the recharge zone of the Edwards Aquifer, the Devils River watershed). Confirmatory investigation is considering responses along the temperature gradient from northern Mexico into Nebraska. Both precipitation and temperature have a strong effect on vegetation growth, which in turn has a strong effect on the radar backscatter. Preferred testing locations contain a mosaic of dense and sparse vegetation with similar soil and landscape position.
Cross comparisons suggest that Sentinel‑1 signals returned from the same location but from different swaths are similar but may have somewhat different response magnitudes. Such discrepancies may arise from different look angles, which may require additional processing steps to fully address. The SMAP, SMOS, CYGNSS, and Sentinel‑1 satellites all have significantly different look angles, so these data sources may have different sensitivities to various landscape features.
Constraining uncertainty in precipitation location and magnitude is important to improving recharge estimates in semiarid environments with sparse gauging. In some cases, available data may miss precipitation events or mislocate them, which causes uncertainty in recharge estimation. The project has found that the wetted outline due to individual rainfall events in semiarid locations, including in some cases the resultant downstream flooding, can be discerned in detail with the Sentinel‑1 data. The wetting pattern is most apparent with reduced vegetation in basins, and requires additional processing to discern when greater vegetation and shallow soil are present. Initial tests suggest that the wetted outline is usually fairly consistent with available precipitation data, although patterns are typically not perfectly consistent. Early analyses for a swath from south Texas into New Mexico and the Great Plains confirmed that large‑scale Sentinel-1 backscatter anomalies are generally consistent with SMAP and SMOS soil moisture anomalies associated with large‑scale storm events, but Sentinel‑1 data are consistent with more moisture, varying from field to field, in areas with ongoing irrigation.
Figure 2 compares change in Sentinel‑1 VV backscatter from 7/4/2018 to 7/16/2018 (left) and PRISM gridded cumulative precipitation over the same period (right). The VV backscatter anomaly on 7/16/2018 is shown for comparison (center). Blue and orange tones in the VV images are consistent with wetting/wetter and drying/drier conditions, respectively; bluer tones in the PRISM image indicates greater precipitation totals. Amarillo is in the top-right corner. The data consistently indicate that the storm track was predominantly in the central part of the images, with scattered precipitation zones elsewhere. Individual fields show dry and wet anomalies that may be due to plowing or irrigation. The team is developing strategies to understand anomalies using complementary data sources, such as Landsat or Sentinel‑2 images.
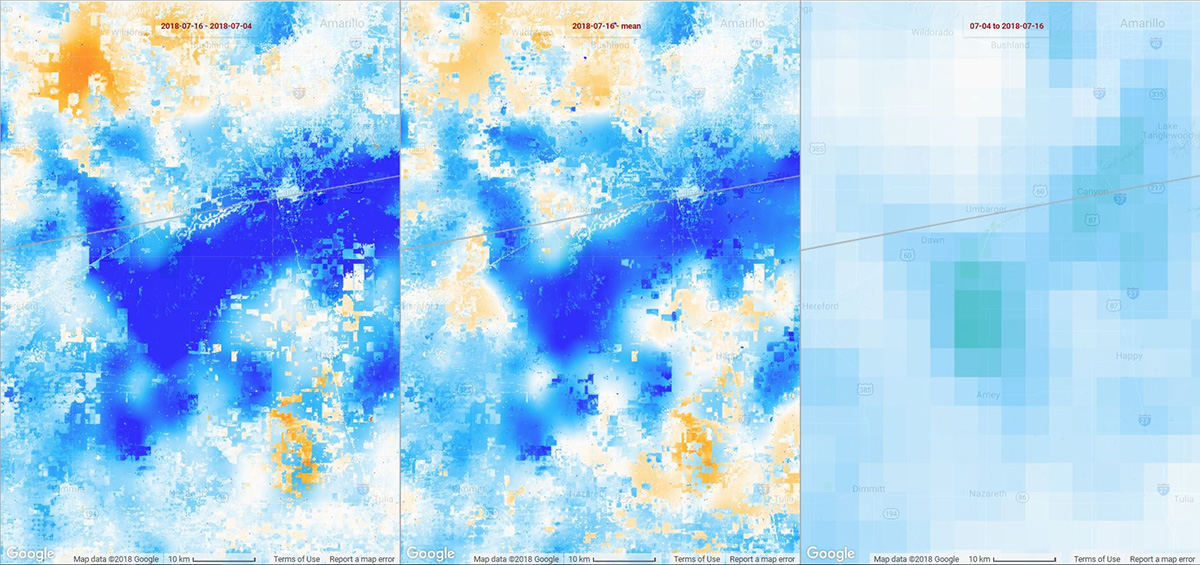
Figure 2: (A) change in Sentinel‑1 VV s (dB) from 7/4/2018 to 7/16/2018; (B) difference between 7/16/2018 Sentinel‑1 VV s (dB) and the average VV s over the period of record; and (C) cumulative precipitation from 7/4/2018 to 7/16/2018 in the GRIDMET gridded database. Amarillo, TX, is in the upper right corner. Blue and orange tones in the VV images are consistent with wetting/wetter and drying/drier conditions, respectively. Changes in s are scaled from −0.5 (red) to 0 (white) to +0.5 (blue). Maximum 12‑day precipitation is ~10 cm. Blue tones in the Sentinel‑1 images generally correspond to larger GRIDMET precipitation, but individual fields may vary due to plowing or irrigation. The GEE platform was used for all processing.