Background
The objective of this proposed project is to develop an understanding of the impact of swirl distortion on centrifugal compressor performance and develop a method to analyze it experimentally and numerically. The aerodynamic performance of a centrifugal compressor depends strongly on the velocity and total pressure profile of the flow when it arrives at the inlet. Thus, one of the primary goals of the design of the inlet piping is to ensure that the flow is as uniform as possible at the inlet plane.
Many manufacturers and operators today still use design guidelines that were developed in the 1960s and 1970s and that have not been updated since then. Nevertheless, it has been shown that designs that rely only on these guidelines can result in significant flow distribution problems that significantly affect the performance of the machine.
Because the performance of each machine is unique, there are not any general reduced-order methods that can be used to predict the performance losses caused by improper inlet piping design. Thus, this presents an opportunity to develop a process that can predict, on a case-by-case basis, the shape of the velocity profile as it arrives at the impeller and how it will affect the performance of the compressor.
Approach
Computational fluid dynamic (CFD) simulations will be used to quantify the uniformity of the velocity profile and amount of swirl at the compressor inlet plane for different piping layouts. The effect of those layouts on the performance of a generic impeller wheel will then be tested in the Single Stage Test Rig (SSTR). The data from the experimental study will be used to validate the CFD simulations and to develop an understanding of how compressor performance is influenced by the incoming flow. The amount of swirl will be varied by increasing the length of the section of straight pipe between the last elbow in the layout and the impeller.
Accomplishments
To date, the SSTR has been used to test two customer-fabricated impellers since the SwRI-designed impeller took over 6 months to complete. Figure 1 shows the SSTR assembled with an elbow placed 1 pipe diameter upstream of the impeller while Figure 2 shows the setup with an elbow located 10 pipe diameters upstream.
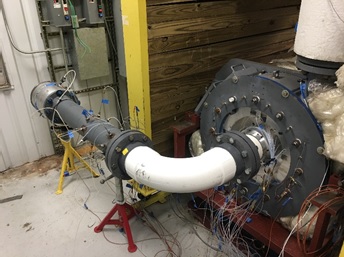
Figure 1: Custom-designed Impeller for Inlet Distortion Studies
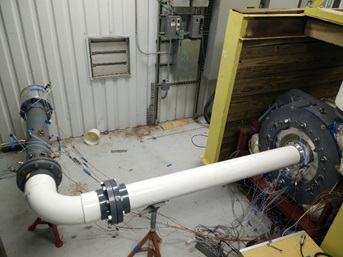
Figure 2: Experimental Testing of Inlet Flow Distortion in the SSTR with the Elbow 2 Diameters Upstream of the Impeller
Figure 3 shows the measured performance of the impeller for several configurations. Here, the isentropic efficiency of the impeller is plotted against mass flow rate at the design speed line of the impeller. The differences in efficiency are minimal for all tested cases. This result indicates that the guidelines often used in industry to estimate how far upstream to locate an elbow to avoid swirl effects may not be correct. In fact, according to these measurements, using such guidelines may result in longer lengths of pipe than are needed which also result in heavier and more expensive installations.
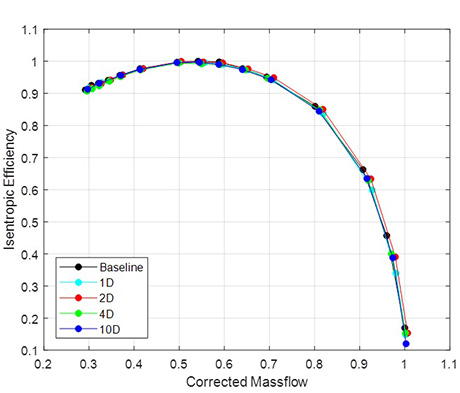
Figure 3: Normalized isentropic efficiency as a function of normalized corrected mass flow for the baseline as well as the elbow configurations.
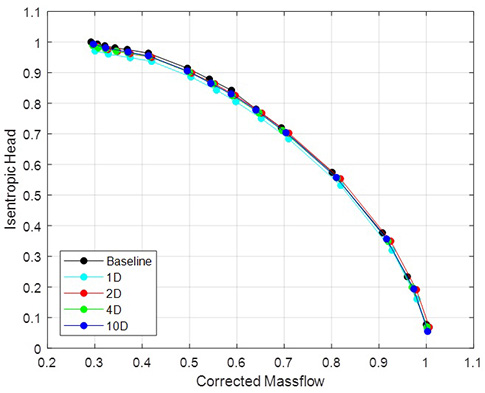
Figure 4: Normalized isentropic head as a function of normalized corrected mass flow for the baseline as well as the elbow configurations.
Figure 7 shows the total pressure loss created by the elbow at the design flow condition while Figure 8 shows the swirl angle created by the elbow at this same condition. These images show that there was flow distortion caused by the elbow at the impeller inlet created by the elbow. Both of these images are oriented as if one as looking at the impeller face from the inlet.
The total pressure loss profile shown in Figure 7 is typical of flow around a bend with the most pressure loss measured on the left side of the profile nearest to the elbow’s inner radius. The swirl angle pattern shown in Figure 8 is also consistent with a twin swirl pattern created by flow around a bend as it contains areas of low and high swirl angle roughly in line with the Y=0 line of the profile. The probe was only able to measure the flow 0.25 inches from the probe wall and it is anticipated that higher swirl angle would have been measured in these locations.
The profiles in Figure 7 and Figure 8 were measured 1D downstream of the elbow at the design flow rate and were corrected by subtracting the flow angles measured a straight inlet pipe. This correction was done to remove any bias associated with probe and rotator alignment as well as probe bending due to the flow through the pipe. While these profiles were measured using the same elbow and flowrate as the design condition from the performance data shown in Figure 3 and Figure 4, they were measured using a different impeller.
While swirl distortion certainly can have an effect on compressor performance, the swirl distortion created by the tested configurations in this study had minimal impact. This result shows that swirl distortion is a complicated phenomenon and that the referenced guidelines are too generalized to be broadly applicable. In this situation, these guidelines would have required an inlet piping configuration that would have been unnecessarily long which would add additional piping costs and complexity to a permanent installation of this compressor.
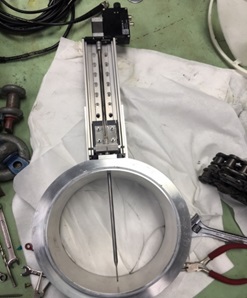
Figure 5: Rotator and traverse assembly
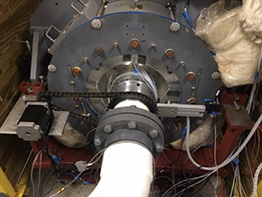
Figure 6: Rotor and traverse assembly installed in the SSTR rig
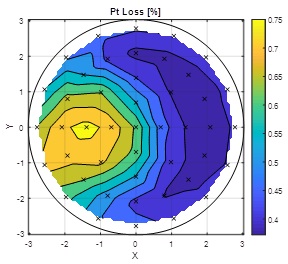
Figure 7: Contour of total pressure loss at the measurement plane. The black x’s in this figure represent the probe positions used to build the contour plot.
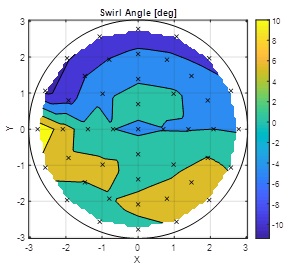
Figure 8: Contour of swirl angle the measurement plane. The black x’s in this figure represent the probe positions used to build the contour plot.