Background
The purpose of this project was to experimentally produce tholins and investigate structural and chemical differences as a function of pressure. Since the discovery of Titan’s atmosphere in 1944, findings from Voyager 1 and 2 and most recently Cassini-Huygens have pointed to unique atmospheric chemistry involving nitrogen (N2) and methane (CH4). This unique chemistry leads to tholins, thought to be responsible for the brown/orange haze in the atmosphere. The Ion Neutral Mass Spectrometer (INMS) of Cassini-Huygens measured C3H8, C4H2, HCN, HC3N, C6H6, and C2N2. The Cassini Plasma Spectrometer (CAPS) sensors, the Ion Beam Spectrometer (IBS) and Electron Spectrometer (ELS) revealed what is suspected to be heavy hydrocarbon and nitrile species with the IBS detecting positive ions up to 350 Daltons (Da) and the ELS measuring negative ions up to 13,800 Da. Interest in tholins has sparked many laboratory simulations on creating and analyzing tholins to try and explain Titan’s chemistry. Our motivation for these experiments was to produce laboratory synthesized tholins and collect data of the produced tholins to support a proposal effort to the NASA Roses Solar System Workings program.
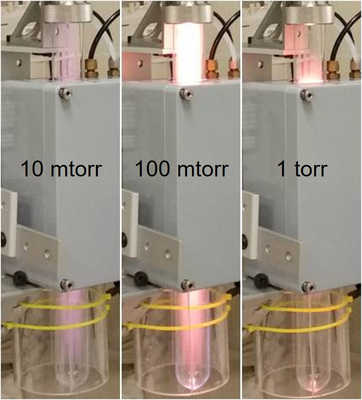 Figure 1: Photographs of the plasma produced at the three pressures investigated for this project.
 Approach
We employ an RF cold plasma generator to make tholins. The RF cold plasma is driven by an Advanced Energy RFX600-A RF power supply. The RF frequency of this device is 13.56 MHz ± 0.005% with output power regulation. We studied the production of tholins from a 98% N2 / 2% CH4 gas mix at three different pressures: 0.01, 0.1, and 1 torr. A photograph of the plasma produced at these three respective pressures is displayed in Figure 1. A quartz tube is placed inside the coils of the RF device and the produced tholins deposit on the walls of the quartz tube. The walls of the quartz tube were scraped with a spatula to transfer solid sample into a plastic weigh boat and then adhered to the SEM sampling stages with an adhesive tape. The sample stages were sputter coated with a conductive layer of gold/palladium and then inserted into the scanning electron microscope for imaging. After SEM analysis, remaining tholins on the walls of the quartz tube were rinsed with different solvents and then dissolved further for mass spectrometry analysis.
Accomplishments
We have successfully produced and analyzed tholins at the three pressures investigated. SEM images produced from the tholins at these pressures are displayed in Figure 2. Interestingly, at 0.01 torr, 2 to 5 µm thin films were observed with some small spherical structures (~0.5 to 1 µm diameter). At the medium pressure of 0.1 torr, 20 to 30 µm films were observed with porosity and tubular structures. The highest pressure investigated, 1 torr, again showed spherical structures but without any signs of a film layer. Mass spectral analysis was performed in both positive and negative ion modes. A variety of solvents were also investigated and anhydrous Dimethylformamide (DMF) proved to be the best solvent at dissolving the solid tholins. The positive mode mass spectra for the tholin samples produced at the three different pressures are displayed in Figure 3. We also determined the chemical identity and potential chemical structures of the most abundant ion signals. We used this data to support our proposal submission to the NASA Roses Solar System Workings program.
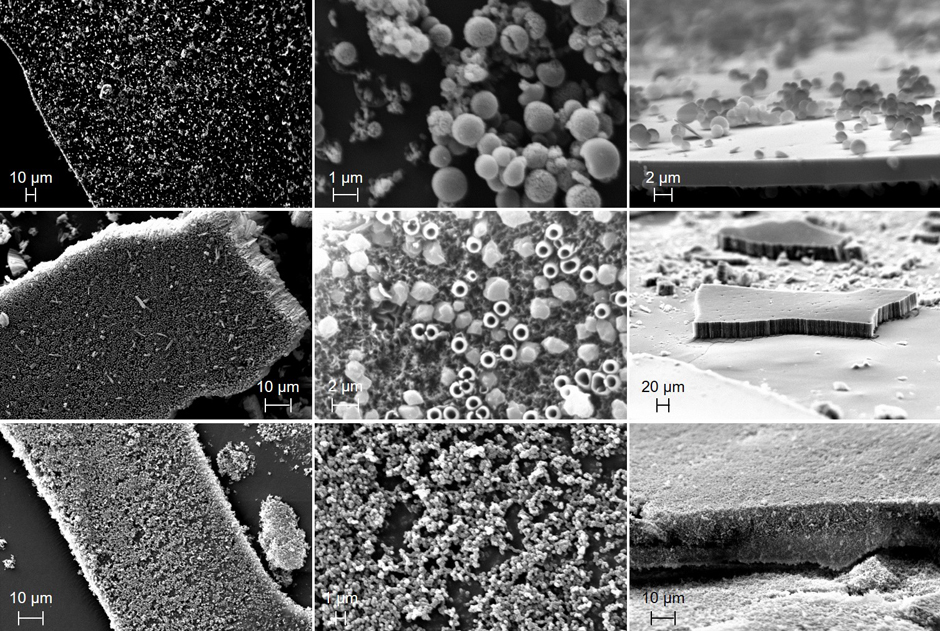
Figure 2: SEM images of the tholins produced at the pressures of 0.01 torr (top row), 0.1 torr (middle row), and 1 torr (bottom row). The panels are top down view seeing a whole piece of solid material (left), zoomed in to see structure (middle), and side view (right).
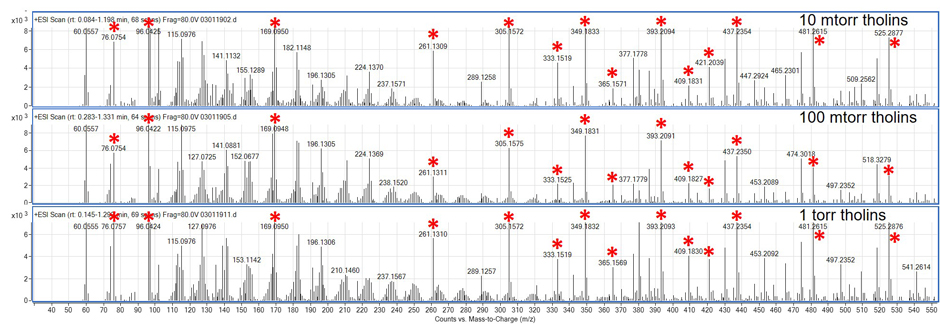
Figure 3: Positive ion mode mass spectra of the three pressures of simulated tholins with ions contained in the sample blank labeled with a red asterisk.