
Background
This project focused on the growing field, within industrial robotics, of using collaborative robots (force and torque limited robots) in industrial manufacturing situations. Specifically, this project sought to use collaborative robots to enable closed loop force control on surfaces to perform various processes, such as sanding. The work utilized open source software that had already been developed to enable simultaneous force and position control but lacked all the functionality required for most industrial manufacturing scenarios. This project developed and evaluated a software solution that is hardware agnostic and enables more precise control over the many variables necessary for a robot to function properly in a manufacturing environment.
Approach
The project was divided into two major phases. The first phase was to investigate the existing software interfaces for force and position control, followed by the second phase of developing software that would build upon this knowledge to create a system that could meet all the project’s goals. Final testing was to perform a simulated sanding process, using a Universal Robotics (UR10e) collaborative robot on various surfaces.
Accomplishments
A software solution was successfully developed that enabled the implementation of a hardware agnostic solution for manufacturing environments. Specific target metrics of following a complex path, moving at a controlled speed of at least 5 cm/s with +/- 15% accuracy, and applying a force of 60N with +/-15% accuracy were all exceeded. Figure 1 shows the results from testing a simulated sanding process on a flat surface. The top graph displays accurate path following through a sine wave pattern. The bottom two graphs show the system achieving a target speed of 10 cm/s and a target force of 60N. These parameters demonstrate a capability of working in a manufacturing environment.
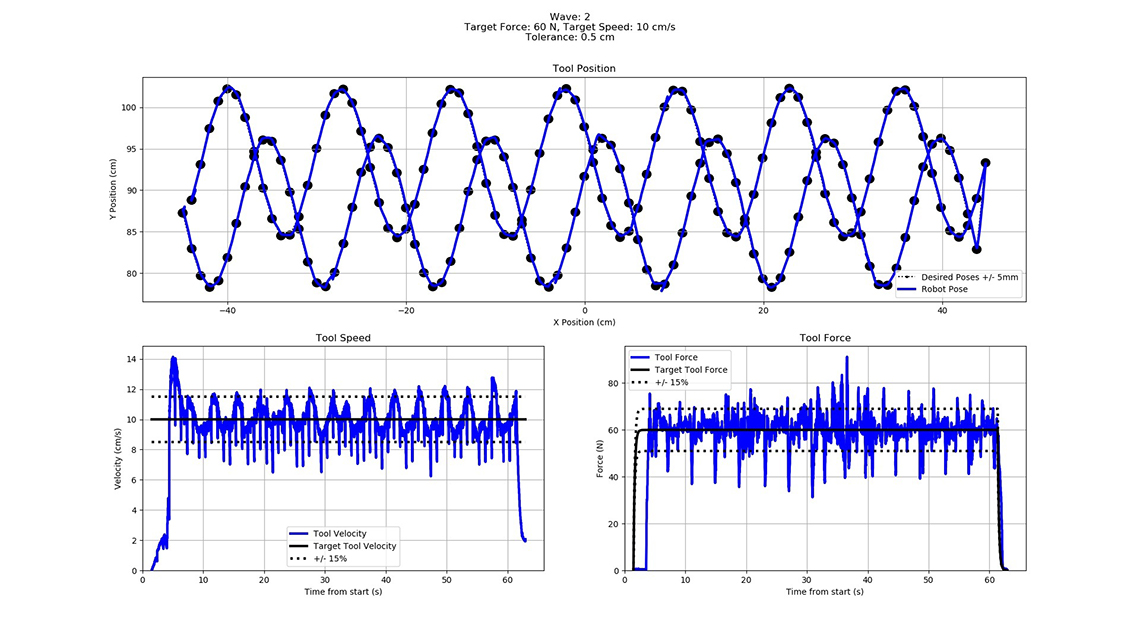
Figure 1: Testing results of simulated sanding process.