
Background
Double-hit lymphomas are high-grade forms of diffuse large B-cell lymphomas. Polyploid lymphoma cells (i.e., treatment-resistant cells with more than one set of chromosomes) are often formed during chemotherapy, resulting in about 80% chemotherapy failure and an average 2-yr survival rate of 20% (Crump, et al., 2017). Without combatting polyploid cell formation, the patient often resorts to a loop of treatment, remission, relapse, and eventually death. The University of Texas Health Science Center of San Antonio (UT Health) is developing drugs to prevent polyploidy in cancer treatment. Polyploid cells are not distinguishable on CT or PET scans, so assessing effectiveness is time consuming and not scalable. Identifying polyploid cells after treatment could help determine drug effectiveness.
Approach
Images of lab-generated cells that include polyploidy have been obtained from Dr. Daruka Mahadevan’s lab at UT Health. With assistance from hematopathologists at UT Health, polyploid cells are labeled and the labeled images are used to train an algorithm to identify count, location, and area of polyploid cells. Once this stage of the project is complete, the algorithm will be implemented on a stack of images from human or mice tissue and then a registration algorithm will be used to construct a 3D model of the tissue.
Accomplishments
Thus far in the project, we have developed a labeling tool that imports images of cells and offers a number of different labeling techniques. We manually labeled approximately 150 cells. Using an AI-driven module, the computer labeled about 75 more cells from the remaining images. Initially, the computer was trained to classify each cell as non-polyploid, polyploid-4n, -6n, or -8n (refers to number of chromosomes); however, inaccurate results when using the AI algorithm motivated a different method. Instead, the computer was trained to identify each cell boundary and each nucleoli. Then, to classify each cell as polyploidy or not, the updated software counts the number of nucleoli within each cell boundary. This method significantly improved the results, which can be seen in the images below.
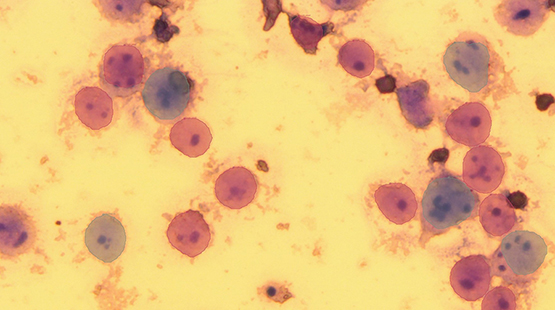
Figure 1: Results from method 1. The red labels are predicted non-polyploid cells and the blue labels are predicted polyploid cells. A few of the labels do not accurately encompass the cell boundaries. The image also indicates many false negatives where cells with more than one nucleolus (indicating polyploidy and should be labeled blue) are labeled as non-polyploidy (red).
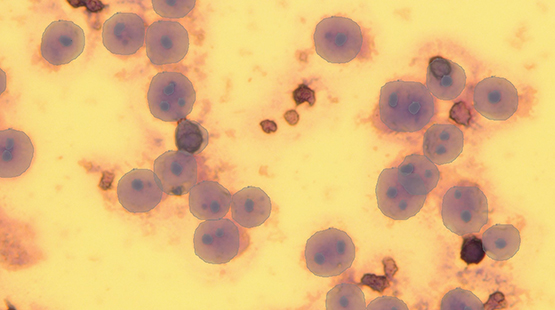
Figure 2: Results from method 2. Cell boundaries (i.e., the larger labels) are more accurate and almost all nucleoli (i.e., smaller labels within the larger labels) are correctly labeled.