Background
The primary objective was to generate improved estimates or calculations of soil moisture at two scales by melding remote sensed data using delay-Doppler maps (DDMs) retrieved from the Cyclone Global Navigation Satellite System (CYGNSS) and ground-based, point-scale measurements collected at National Ecological Observation Network (NEON) terrestrial field sites.
Approach
Eighteen NEON terrestrial field sites located at latitudes less than 38° were selected for inclusion in this study. Six of the selections are core terrestrial field sites. These are CLBJ, ORNL, OSBS, SJER, SRER, and TALL. Twelve relocatable terrestrial field sites were selected. These are DELA, DSNY, GRSM, GUAN, JERC, JORN, LAJA, LENO, MLBS, OAES, SOAP, and TEAK. As illustrated in Figure 1, the selected sites span a variety of climatic and ecological conditions, representing a broad range of precipitation and soil moisture environments.
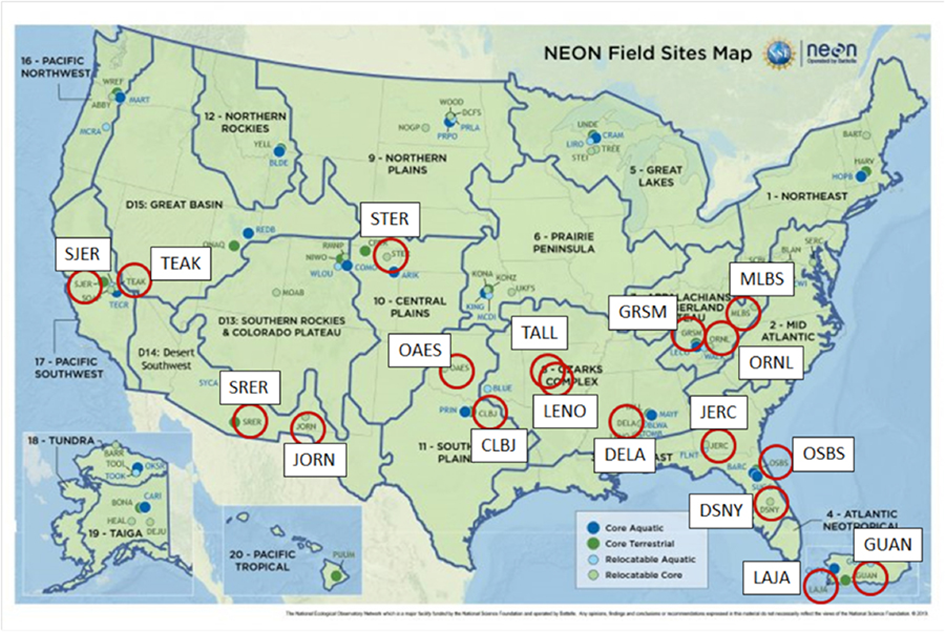
Figure 1: Locations of the core and relocatable NEON terrestrial field sites. Sites selection for inclusion in this study are denoted with a red circle.
Time-scale differences were matched by averaging NEON data over six hours to match the scale of the CYGNSS data. Therefore, many CYGNSS files are required to match the data of one NEON data file. Spatial scales were matched by determining the closest CYGNSS latitude and longitude data patch nearest to the NEON site and also averaging data of the four nearest CYGNSS data patches. In general, all four CYGNSS patches were within 40 km of the NEON terrestrial field site tower.
Accomplishments
Comparisons of soil moisture are presented by plotting soil moisture values calculated using remote-sensed data from CYGNSS with in situ values measured at the NEON terrestrial field sites. Agreement between the two sources of soil moisture data varied among the 18 locations that suggests commonalities between the two data sets; however, these agreements are not pervasive and reasons for agreement or differences among the data are not yet fully understood. Two results showing good agreement are OAES and JORN (Figures 2 and 3). With OSBS, CYGNSS values consistently exceed NEON measurements (Figure 4). With DSNY, differences vary from where CYGNSS values exceed NEON measurements to periods when there is relatively good agreement between the two (Figure 5).
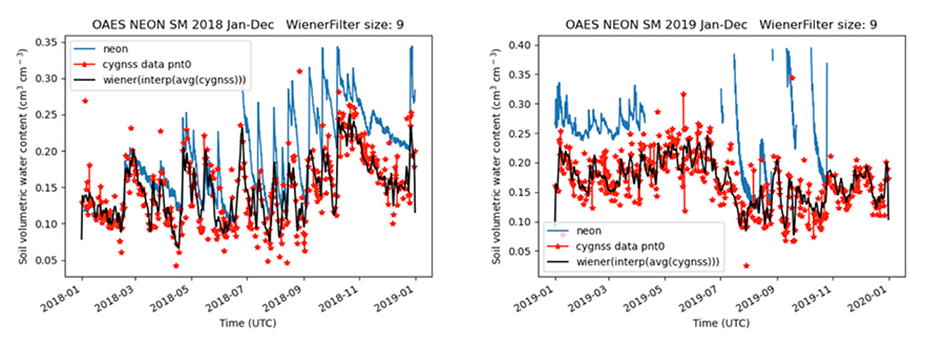
Figure 2: Remote-sensed and ground measurements of soil moisture at NEON terrestrial field site OAES for the period 2018-2020. Average ground-based soil-moisture measurements are denoted with the blue line. Remote-sensed values from the four CYGNSS locations are included as red dots. A Wiener average of the CYGNSS data is included as a black line. Comparisons show excellent agreement between in-situ and remote sensed data.
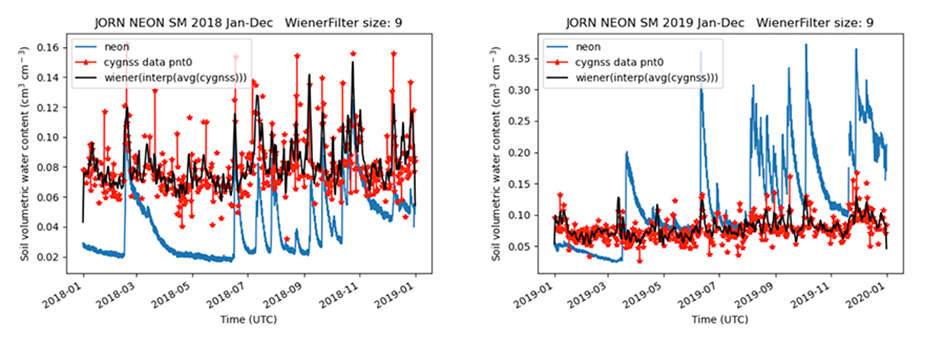
Figure 3: Remote-sensed and ground measurements of soil moisture at NEON terrestrial field site JORN for the period 2018-2020. Average ground-based soil-moisture measurements are denoted with the blue line. Remote-sensed values from the four CYGNSS locations are included as red dots. A Wiener average of the CYGNSS data is included as a black line. Comparisons show good agreement between in-situ and remote sensed data, but was low during 2018.
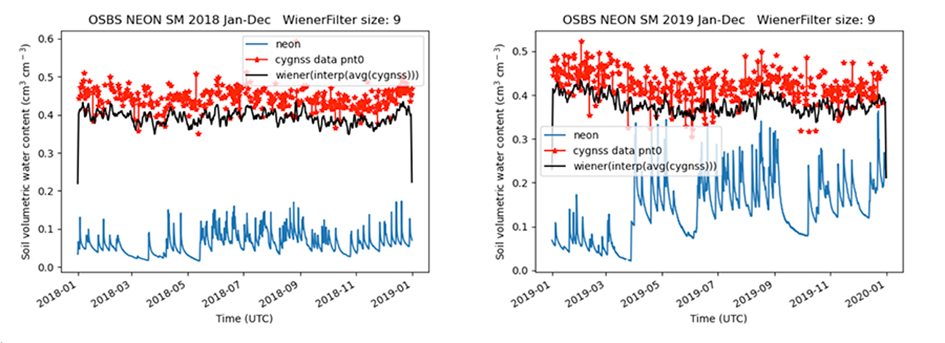
Figure 4: Remote-sensed and ground measurements of soil moisture at NEON terrestrial field site OSBS for the period 2018-2020. Average ground-based soil-moisture measurements are denoted with the blue line. Remote-sensed values from the four CYGNSS locations are included as red dots. A Wiener average of the CYGNSS data is included as a black line. Comparison shows CYGNSS consistently exceeding NEON measurements.
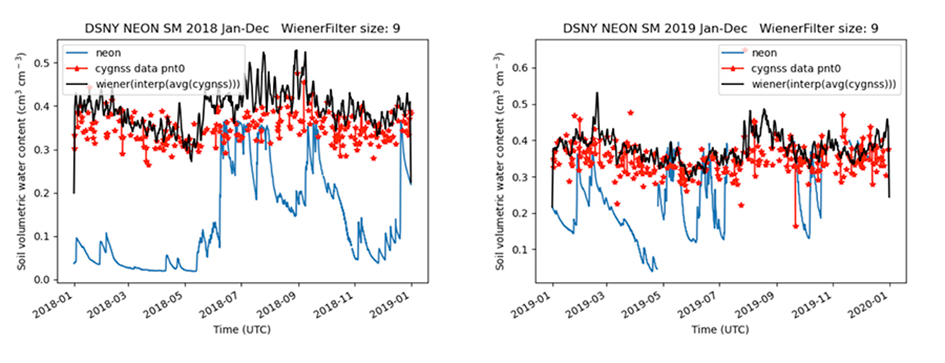
Figure 5: Remote-sensed and ground measurements of soil moisture at NEON terrestrial field site DSNY for the period 2018-2020. Average ground-based soil-moisture measurements are denoted with the blue line. Remote-sensed values from the four CYGNSS locations are included as red dots. A Wiener average of the CYGNSS data is included as a black line. Comparison shows CYGNSS exceeding NEON measurements, but not consistently.