
Background
Traditional lab-based biomechanical analysis of baseball pitchers is used as the standard to identify pitchers with mechanics that predispose them to shoulder and elbow injury. While informative, these traditional analyses have two key limitations that narrow their utility in reducing pitching injuries. First, the difficulty and time-consuming nature of traditional systems bounds studies to small sample sizes that may not be indicative of the broader subject population, and severely restricts the prospective investigations of pitching mechanics as injury risk factors and longitudinal investigations of the effect of interventions designed to reduce injury. As a result, widespread use of this technology is limited. Second, the findings from traditional analyses are limited to cross-sectional correlations between groups of people rather than identifying cause-effect relationships between biomechanical factors and injury outcomes for individual pitchers.
The purpose of this research was to address these limitations by demonstrating 1) the accuracy and reliability of a markerless biomechanics system for pitching analyses using only video cameras and 2) the utility of using predictive musculoskeletal simulations to identify cause-effect relationships related to youth baseball pitching injuries.
Approach
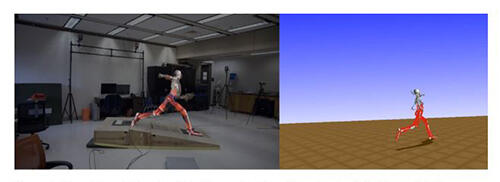
Figure 1: Example workflow to obtain kinematic values for a single pitch. The image on the left shows the inverse kinematics pose of the musculoskeletal model overlaid on the raw image. The image on the right shows the musculoskeletal model in 3D space.
We simultaneously collected video data, optical motion capture, and ground reaction forces from 11 pitchers throwing 15 fastballs each. The videos were first processed through a convolutional neural network that creates pose estimates of anatomical markers on the pitcher’s body. Then, an inverse kinematic fit was applied to transform the marker locations into the kinematic parameters (Figure 1). The predicted kinematic parameters were used as input to a long-short term memory (LSTM) network to predict GRFs and COP. The accuracy of the neural networks was evaluated against the ground truth data kinematic and kinetic data measured by the optical motion capture system and forces plates respectively.
We then performed a forward dynamics optimization using one pitch from the dataset to identify pitching mechanics that reduce injury risk (joint torques/stress on shoulder and elbow) while maintaining pitching performance (ball velocity).
Accomplishments
Pitching kinematics and kinetics were collected exclusively from 4 off-the-shelf video cameras. The kinematics showed excellent correlation to traditional optical motion capture with median Pearson coefficients ranging between 0.90-0.99 (Figure 2), and ground reaction forces were predicted within 1.2 N/kg of force plates. We also implemented a forward dynamics optimization using one pitcher’s baseline pitching mechanics to predict the mechanics that reduced shoulder internal rotation moment by 32% while maintaining or improving ball velocity within 0.1% (Figure 3). The ease of use, portability, and accuracy of the SwRI markerless biomechanics systems has the potential to broaden the impact of biomechanical analysis to pitchers who do not have access to marker-based tracking systems. In addition, forward dynamics simulations of pitching mechanics with input from the markerless systems can provide information not only into who may be at risk of developing an injury but how individual pitchers can alter their mechanics to reduce injury risk.
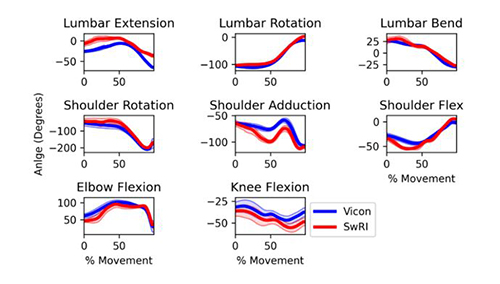
Figure 2: Mean and +/- 1 standard deviation for a representative subject and degrees of freedom of interest. Blue lines represent the optical motion capture (Vicon) results and red lines represent the SwRI markerless results.
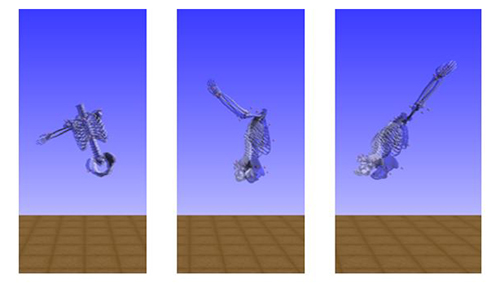
Figure 3: Model Visualization of the kinematics at stride foot contact (left), maximum shoulder external rotation (middle), and ball release (right) for experimental condition (blue model) and optimized condition (white model).