
About the Header
The Salmon Falls Creek Canyon, near Twin Falls, Idaho, is a well-studied locale by researchers investigating the evolution of landslides dating back to 1937. The creekbed is visible in the lower right-hand quarter of this photograph, with the headwall of the landslide forming a bluff in the background.
Landslides and related events are a worldwide threat to human life and property, affecting all 50 states. In the U.S., they cause up to $2 billion in damage and more than 25 deaths each year, according to the U.S. Geological Survey. The annual worldwide death toll from landslides is in the thousands.
Preventing, predicting, or mitigating landslides is complicated, requiring extensive knowledge about the myriad factors involved. A team of Southwest Research Institute (SwRI) scientists set out to find ways to improve monitoring and riskassessment technologies for these often devastating natural disasters.
For many years, geoscientists have used inclinometers and other on-site, ground-based instrumentation to detect and track slope instability. These instruments, inserted into boreholes or placed on the ground surface, map earth movements by linking to high-resolution global positioning system (GPS) data. More recently, wireless sensor arrays have been deployed to monitor landslides.
Using airborne or satellite-based remote-sensing systems can reduce costs of monitoring landslides and also provide rapid, up-to-date digital data over large swaths of terrain. Early remotesensing methods compared a succession of images to map landslide progression over time. More recently, satellite-based Interferometric Synthetic Aperture Radar (InSAR) has used sophisticated processing techniques to recognize and map identifiable, pixel-sized features that appear in pairs of radar images over time. Although InSAR can distinguish spatial relationships and provide information on landslide movement patterns, slow-moving landslides and particularly rugged terrain challenge conventional InSAR techniques. Variable time spans between radar images can also affect accuracy.
About the Authors
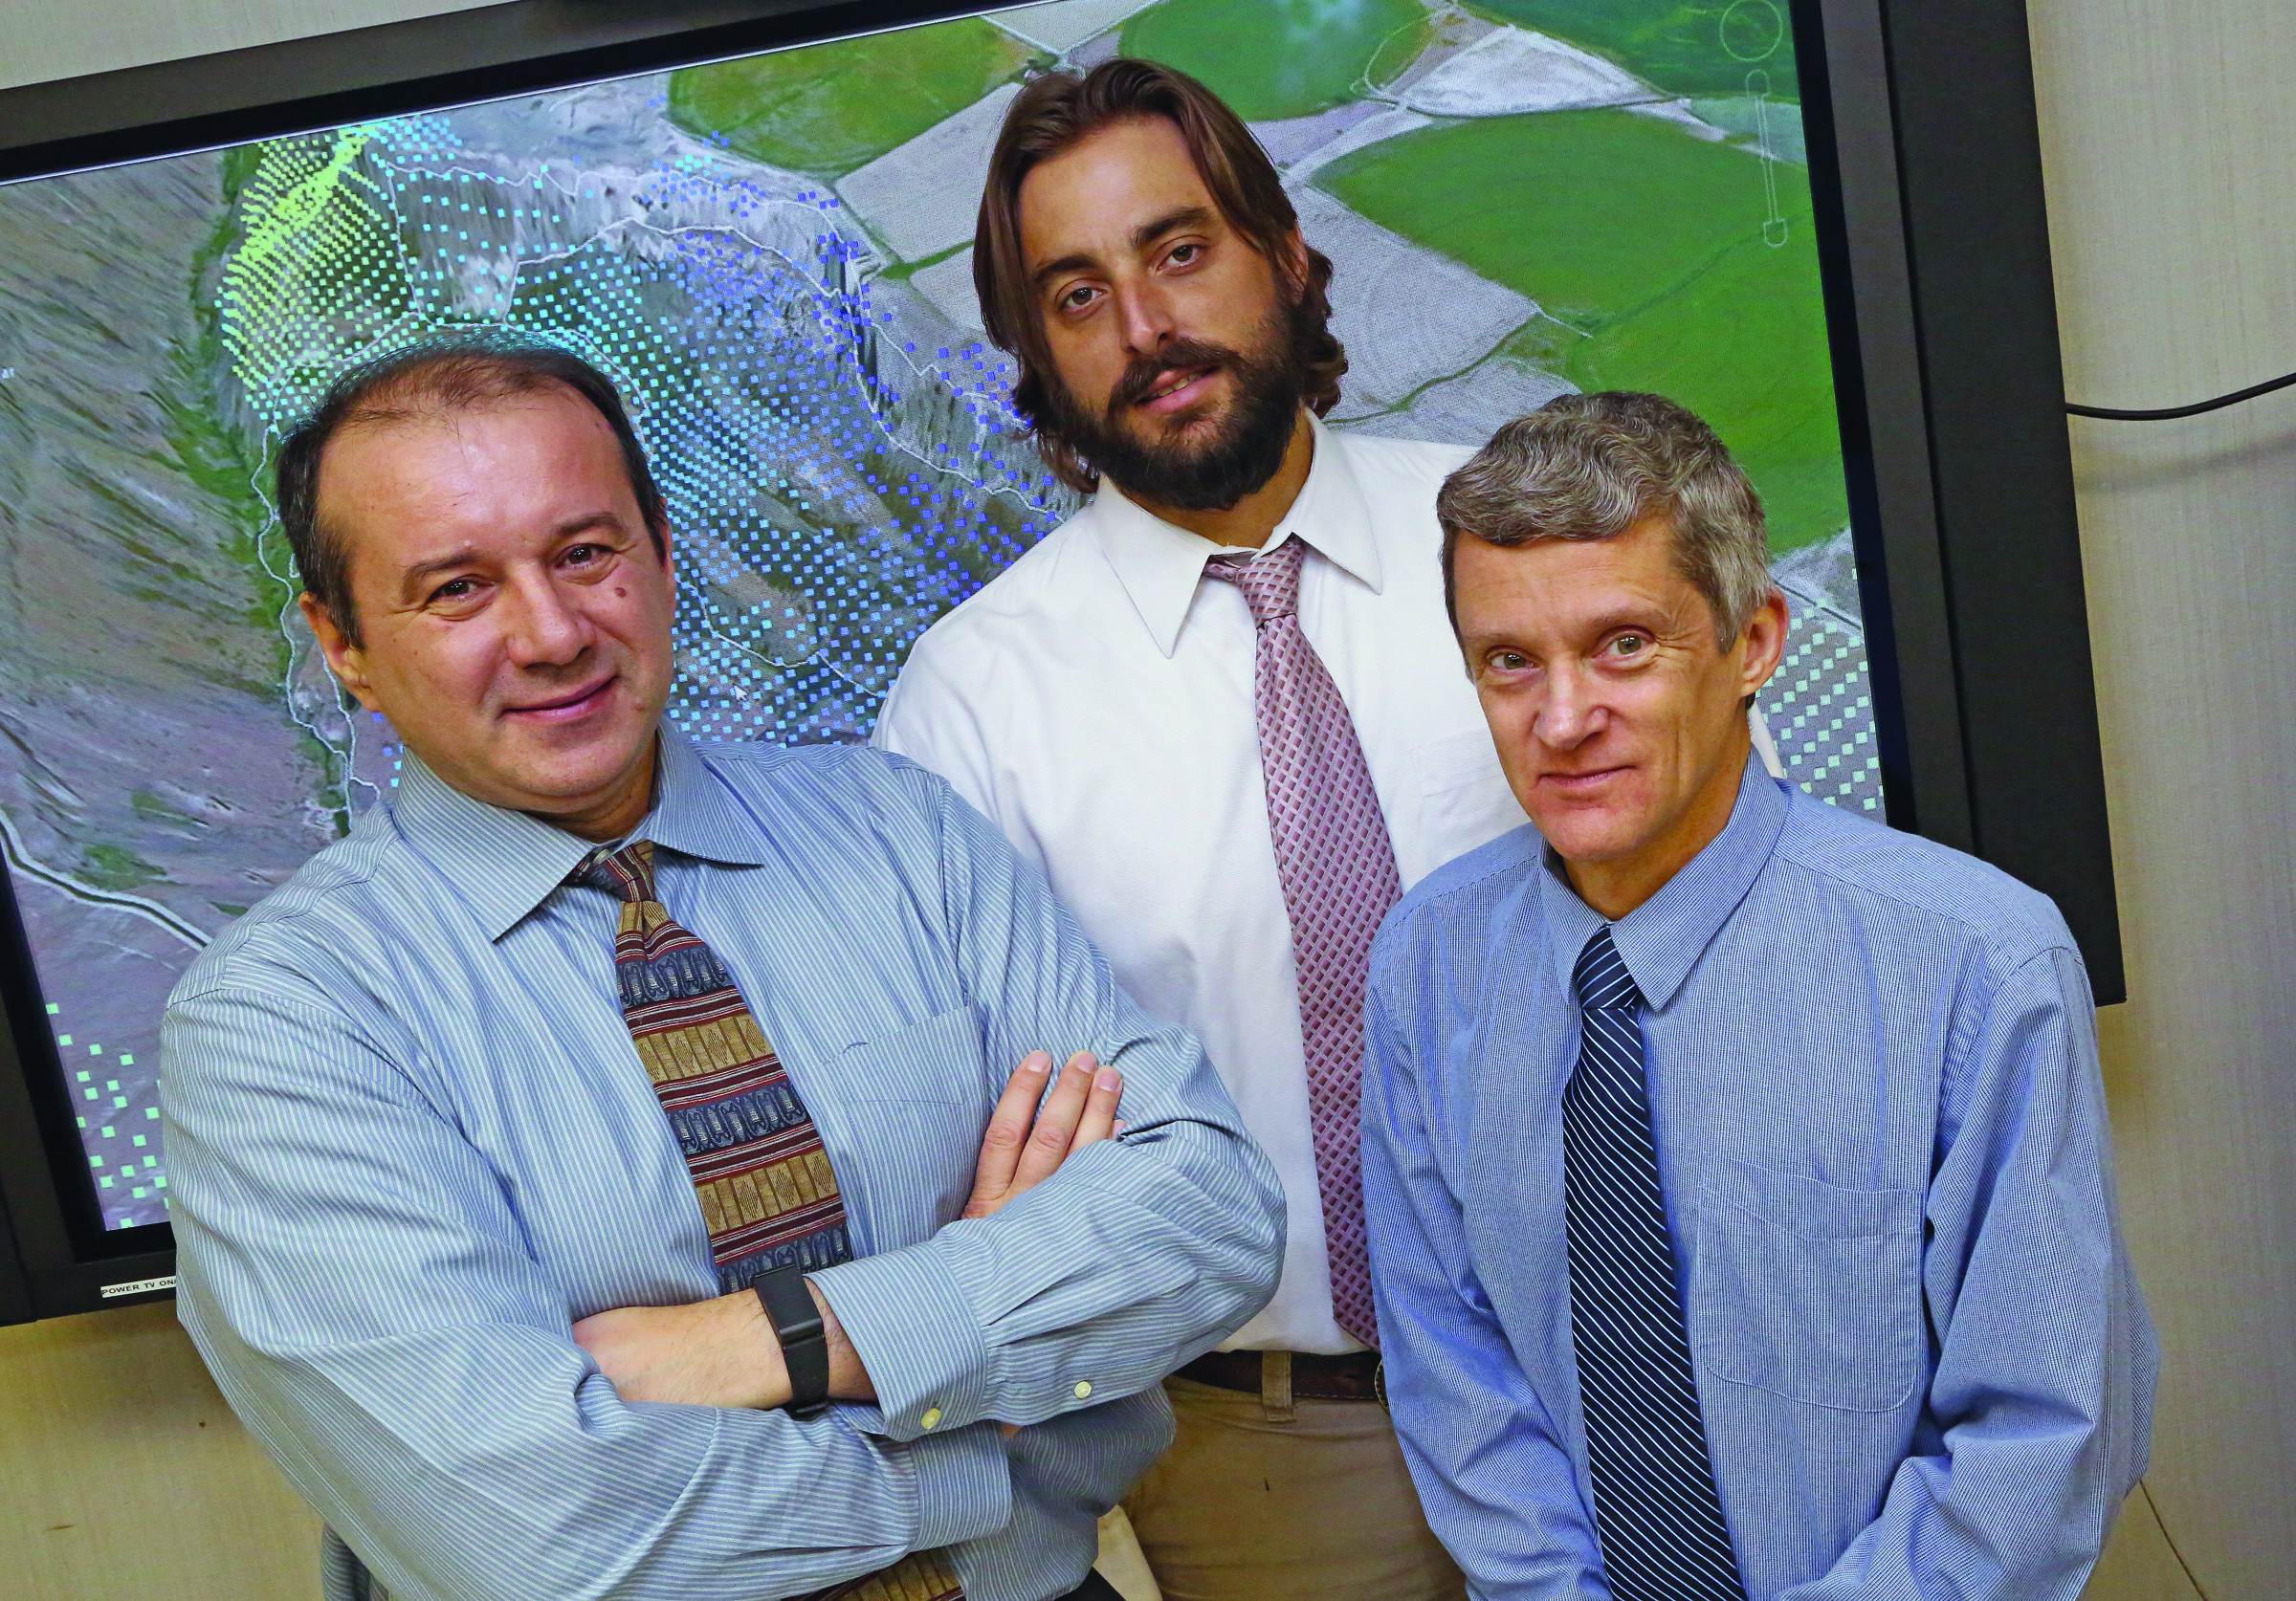
Marius Necsoiu, Ph.D., left, is a principal scientist in the Earth, Material and Planetary Sciences Department. He is an environmental scientist and electrical/electronic engineer with broad national and international experience and expertise in remote sensing systems. Ronald N. McGinnis, center, is a structural geologist and a senior research scientist. His expertise includes quantitative and qualitative analyses of the origins of structural geologic and tectonic features. Donald M. Hooper, Ph.D., right, is a geologist with expertise in volcanology and geomorphology. His research experience includes landscape evolution and terrain analysis. All are in the Geosciences and Engineering Division.
To address these problems, scientists are applying new processing algorithms for InSAR data that can identify pixels that are said to be coherent, or recognizable across multiple radar images. By applying two of these techniques, Persistent Scatterer (PS) and Small Baseline Subset (SBAS) interferometry, scientists can measure minuscule movements of natural features, such as rocky outcrops and boulders, and man-made structures, such as roads and homes. A team of geoscientists from Southwest Research Institute evaluated the PS and SBAS radar interferometric techniques as a landslide risk assessment tool. The team applied the techniques to archived InSAR images to create accurate motion rate estimates for a landslide area in Idaho. This process also gave insight into the strengths and weaknesses of the two techniques.
Physical setting and local geology
The SwRI team focused on a landslide complex in Salmon Falls Creek Canyon near Twin Falls, Idaho, because the site is well-studied and the team has field experience in the area. In southern Idaho, the Snake River has cut valleys through hard surface basalt and the softer sedimentary strata below, a natural process that has destabilized valley walls, causing landslides. Salmon Falls Creek, a tributary of the Snake River, flows through a narrow canyon that is about 130 meters (427 feet) deep and 375 meters (1,230) feet wide. Ten kilometers (6.2 miles) downstream, landslides have widened the canyon to 1.3 kilometers (0.8 mile).
The Salmon Falls landslide’s headwall, or the point from which the landslide broke away, shows vertical slippage down onto horizontal basalt pavements. Farther down the slope, large basalt blocks dot an area where an earlier slide disrupted and rotated the basalt pavement. Still farther down, a zone of mixed basalt and clay-rich sediment indicates where the landslide probably initiated. The uplifted creek flood-sediment lying atop intermixed basalt and clay shows evidence of repeated landslides.
Landslides periodically dam the creek, leading to concerns about catastrophic flooding downstream if the landslide-formed dam were to unexpectedly give way. The landslide’s fastest recorded movement (45–200 centimeters, or 18–79 inches) per year occurred between 1998 and 2003. As of 2008, the rate of movement on the landslide had significantly decreased to less than 10 cm/yr (4 in/yr). The earliest recorded event in the area was a 1937 landslide about 0.8 km (0.5 mi) north of the later 1998-2003 event. Although much larger than the Salmon Falls landslide, the 1937 landslide is similar in both shape and deformation pattern. The boundary between the two slides is defined by an eastwest shear zone, which provided a basis for differentiating between the movements within the two slides.
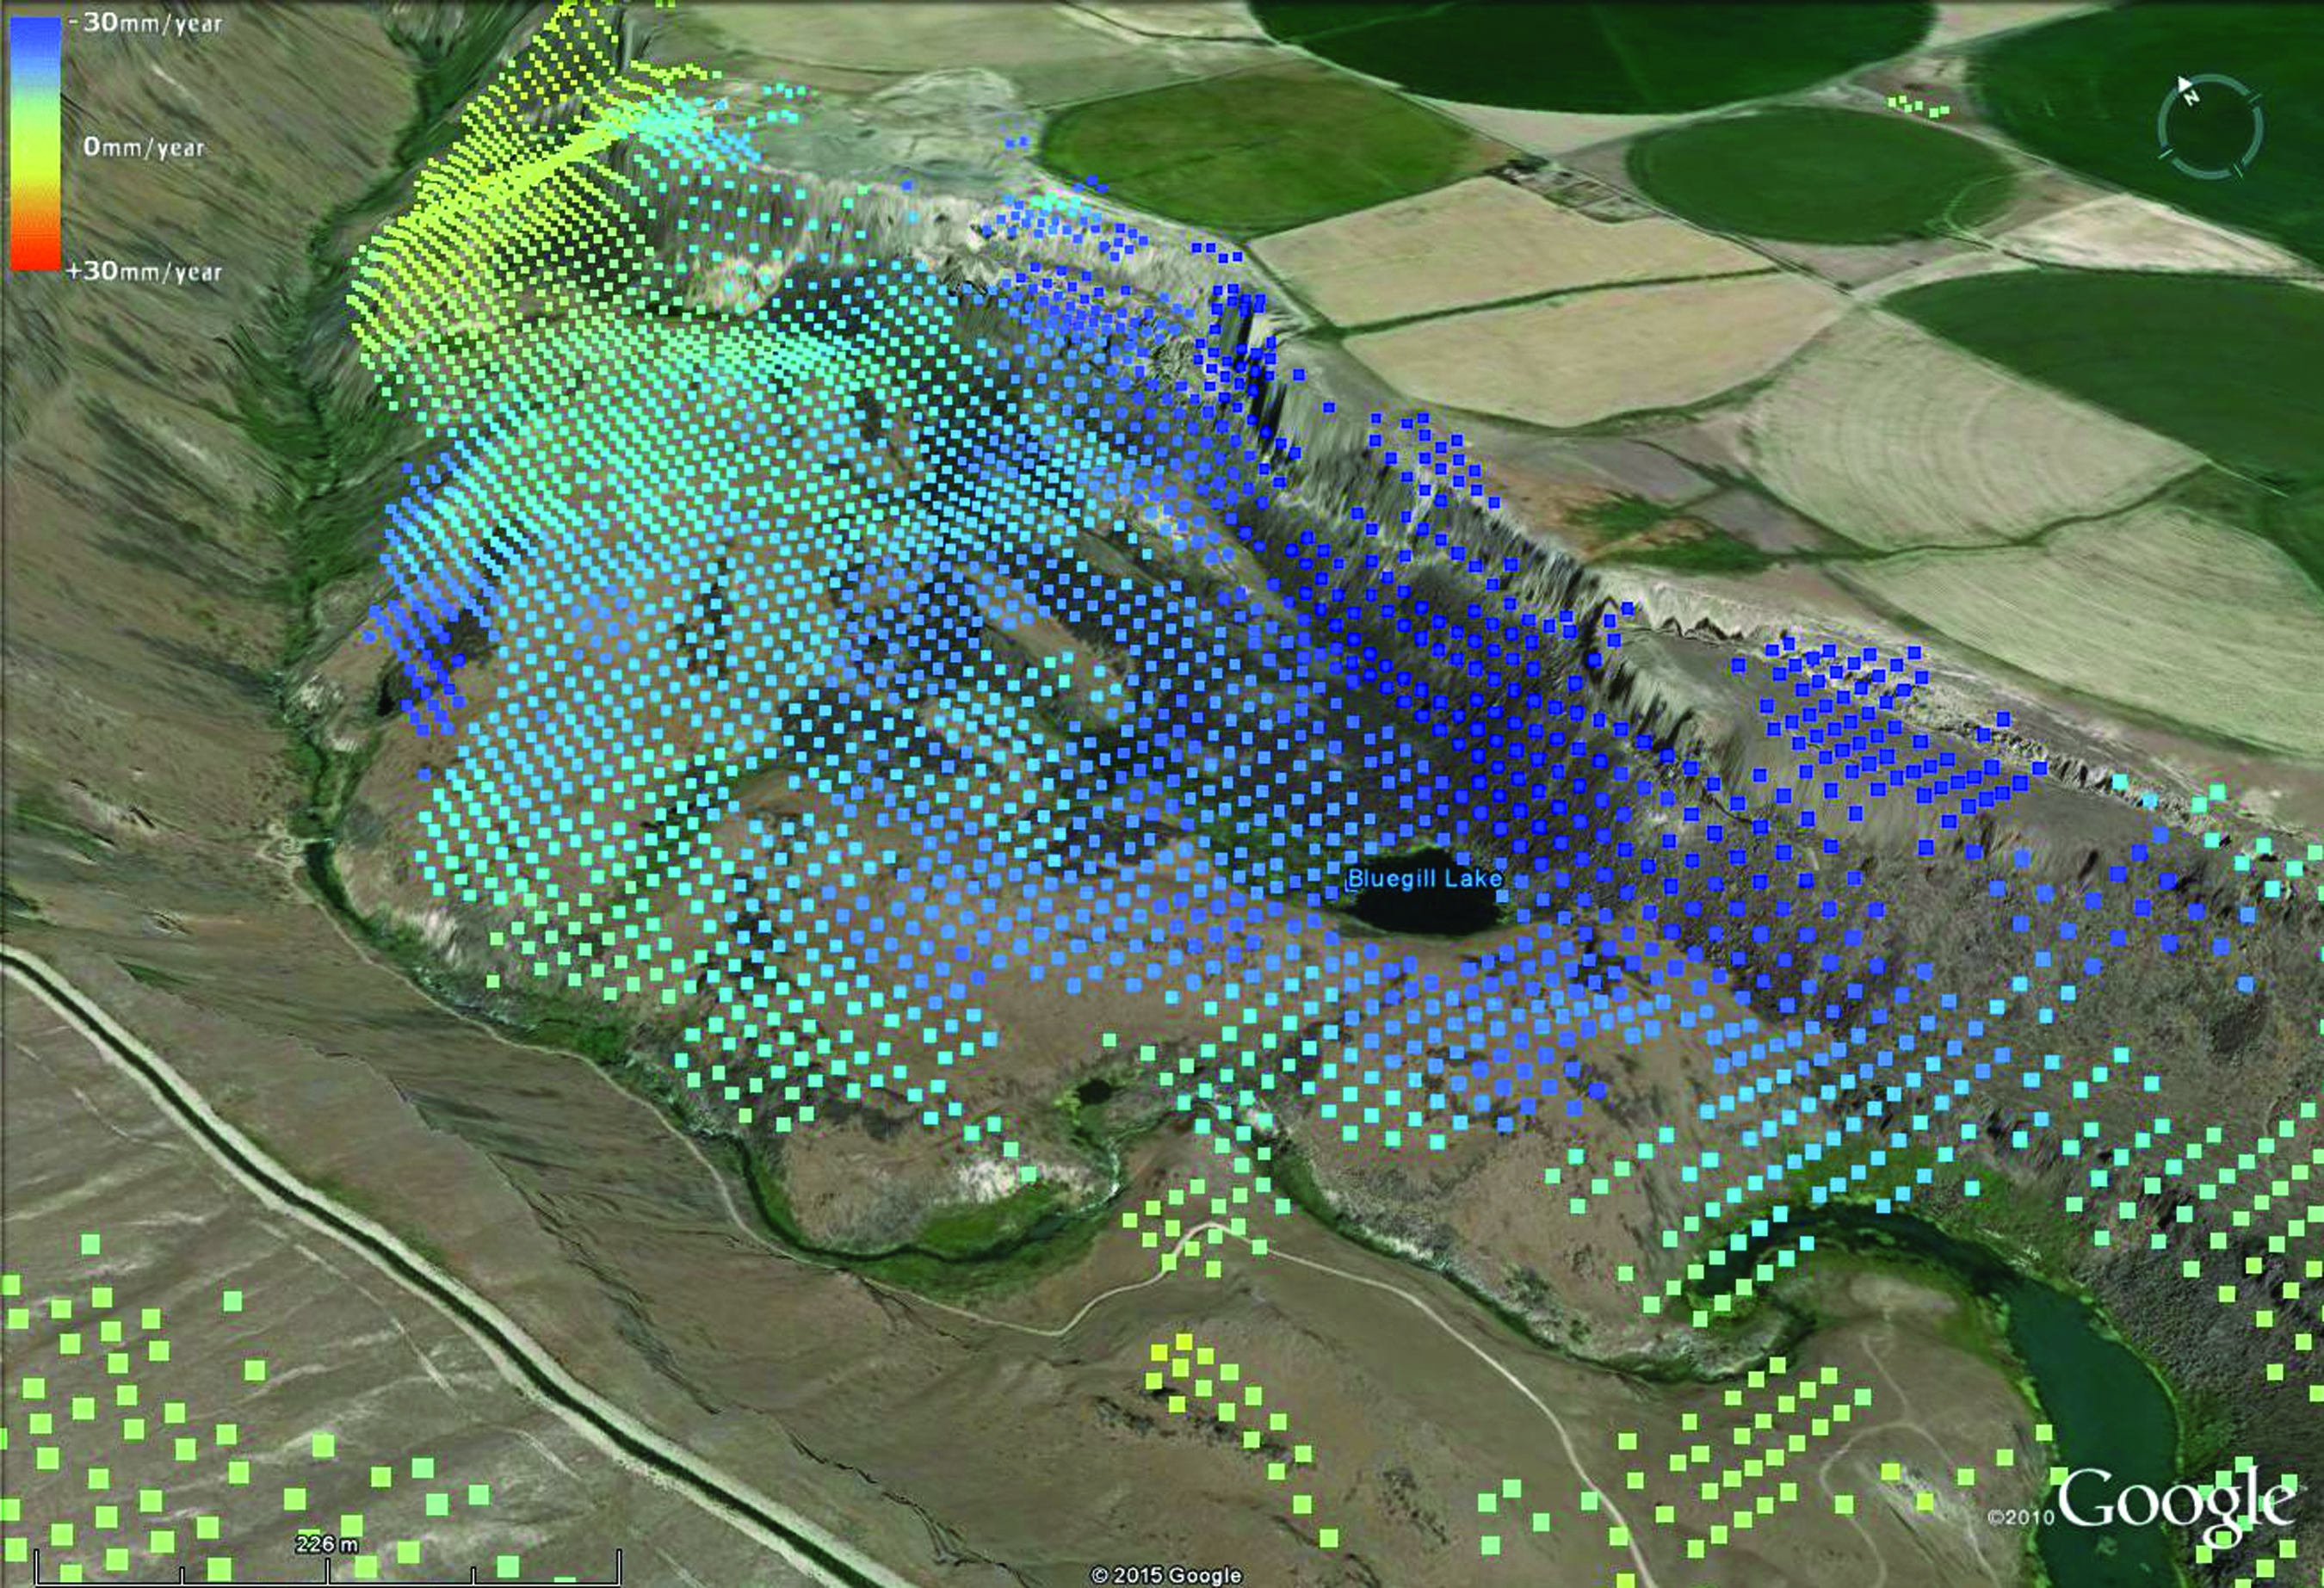
A three-dimensional effect is produced by superimposing a series of dots representing SBAS reference points atop an orthophoto image of the 1937 landslide complex at Salmon Falls Creek, Idaho. (Background image © 2014 Google, USDA Farm Service Agency.)
Remote-sensing data and analysis
The ability to monitor surface movement rates on landslides over time in an inexpen-sive and efficient manner allows scientists to (i) characterize unique movement patterns within a slide complex, (ii) quickly assess potential hazards associated with the slide, and (iii) monitor regularly in order to provide a baseline of move-ment rate data that may help to predict large slide events.
To provide a basis for evaluating the adequacy of alternative techniques, the SwRI team found a large set of historical satellite images of the Salmon Falls Creek area previ-ously acquired by the European Space Agency. The team examined data quantity and type, image time frames, and other factors that affect accuracy, eliminating images obscured by snow, rain, and overcast conditions. They selected two data- sets, 39 images from 1995–2002 and 20 images from 2005–2009.
Next, they gathered field data to compare to the 2005–2009 data-set. Between November 2006 and September 2008, an SwRI-led team conducted seven GPS field surveys at the study site. An autonomous base station achieved survey-grade accuracies, recording 10 locations (nodes) over seven survey campaigns. For each node, the elevation was re-projected in the line-of-sight of the InSAR sensor. The team confirmed displacement values with SBAS-recognized locations within 20 meters of each GPS node.
InSAR analyses generated results over these two time intervals representing estimated total displacement, mean displacement velocities, and displacement history. Finally, the team analyzed specific surface features as persistent scatterers/coherent pixels, recognizable in multiple images over time, for both the 1937 and the more recent Salmon Falls landslides.
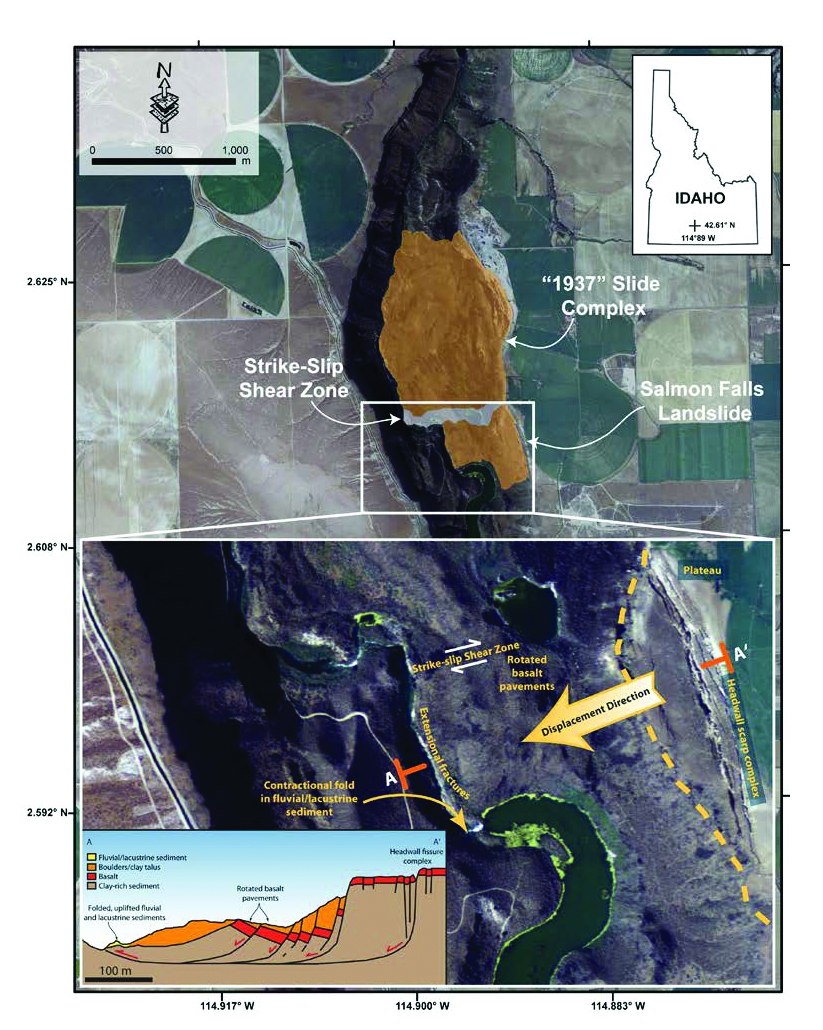
Located 30 miles west of Twin Falls, Idaho, the landslide study area includes the entire Salmon Falls Creek Canyon landslide complex. The white rectangle represents the area shown in the inset at bottom, which in turn shows a roughly east-west cross section of the Salmon Creek Gorge.
Results and interpretation
Both PS and SBAS techniques identified pixels that contain earth movement information along the valley in the unstable area and amid sparse vegetation. The SBAS techniques produced the greatest number of pixels showing movement. However, farming activ-ity around the canyon rim areas disguised any movement pixels in that region. The team saw large variation in movement pixels in the southeastern area, where the canyon drains into the gorge. Due to the arid environment, there were few changes to the drainage system over time, producing correspondingly small variations over time in the radar image. A large number of coherent, or unchanged, pixels recognized in the zone by the PS and SBAS InSAR analyses confirmed this finding.
The spatial distribution of movement detected using InSAR techniques matched the boundaries of the two landslide complexes, as defined by the shear zone between the two. The SwRI team noted that the PS results match the SBAS results in the upper and lower boundaries of the test area. However, they detected almost no PS points in the active zone, probably because PS InSAR is more sensitive to linear displacement that occurs at a uniform rate.
Neither the main scarp, or cliff, from the 1937 landslide nor the headwall scarp from the Salmon Falls landslide showed many pixels from stationary objects. Areas affected by landslides typically have very steep slopes, so any subsequent movement would be most noticeable on the leading scarps of the landslide complex, leaving only a few persistent reference points in such areas.
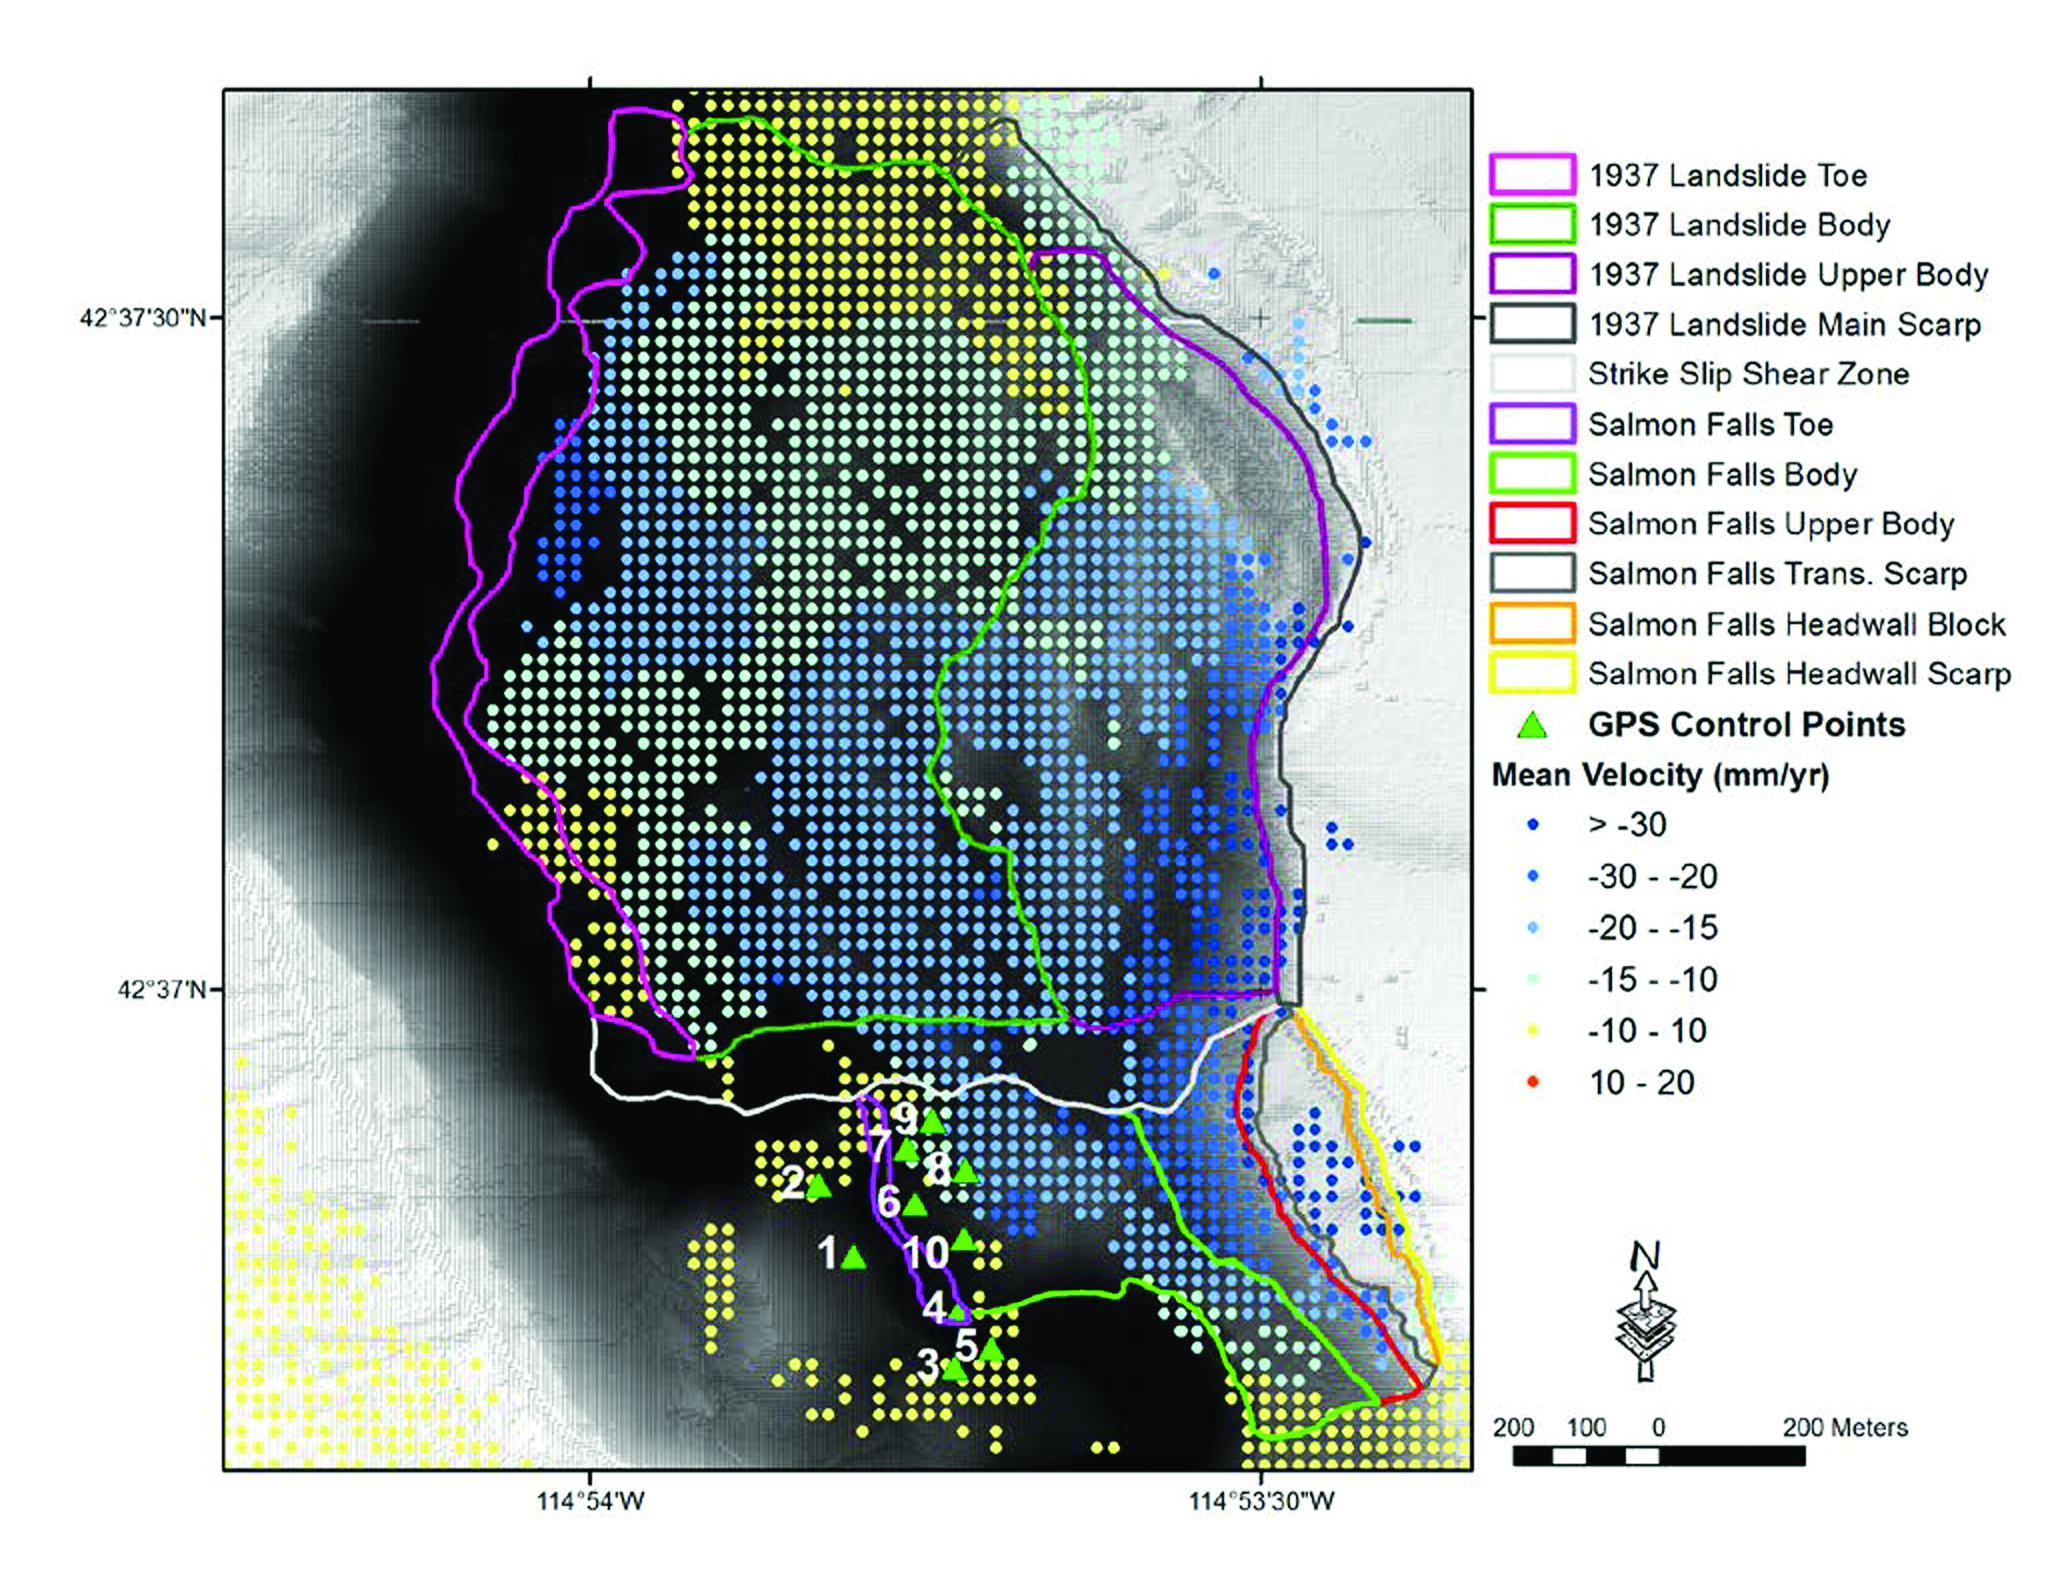
SBAS reference points were detected over the 1937 and Salmon Falls landslide complexes. GPS control locations are shown as green triangles. Negative velocity values on the table beside the graphic indicate motion away from the satellite.
Comparison with field data
A 2003 aerial photograph and a digital elevation model based on Light Detection and Ranging (LiDAR) were used to examine the topography of the landslides and to identify displacement values corresponding to changes in local surface characteristics. Coherent-pixel estimates corresponded to different types of displacement measurements. For example, SAR techniques rely on line-of-sight surface displacement, whereas GPS measures horizontal and vertical displacement. Although dates of field measurements and the satellite images did not match perfectly, qualitative comparisons between the two were still valid. Between November 2006 and September 2008, the cumulative displacement data correlated both in the direction and rates of ground deformation. Interestingly, the Salmon Falls landslide had areas near the bottom where displacement data showed upward, as well as the expected downward, movement of the landslide. This occurred as some blocks rolled down the slide, while others slid down as a large, intact package and pushed against the earlier slide debris, sometimes piling it upward. Looking at 11 representative locations in the two landslides, the team focused on two key parameters: topo-graphic texture, or surface roughness, and average slope.
The texture of the Salmon Falls head-wall block varied by only an average 2.60 m, lowest for any unit measured, indicating a relatively smooth surface. The mean slope angle also was low, indicating that the block slid downslope en masse without much rotation or tilt. However, as the Salmon Falls landslide continues to advance in the future, the blocks will likely rotate and fracture. The toe, or end point, of the Salmon Falls landslide also is smoother than the toe of the older 1937 landslide complex. The difference in surface roughness could reflect greater upward thrusting by later landslides, or more erosion. The top of the 1937 landslide complex has the great-est roughness, 27.46 m. This landslide may have tumbled rather than simply sliding downward, or perhaps it involved a coarser type of rock.
The Salmon Falls landslide headwall, or breakaway area, had the highest aver-age annual velocity. Movement at the toe of each landslide was slower, signifying that movement is more active in the upper reaches. Also, motion at the toe end tends to slow as it becomes more horizontal, while headwall motion is mostly vertical and therefore more rapid.
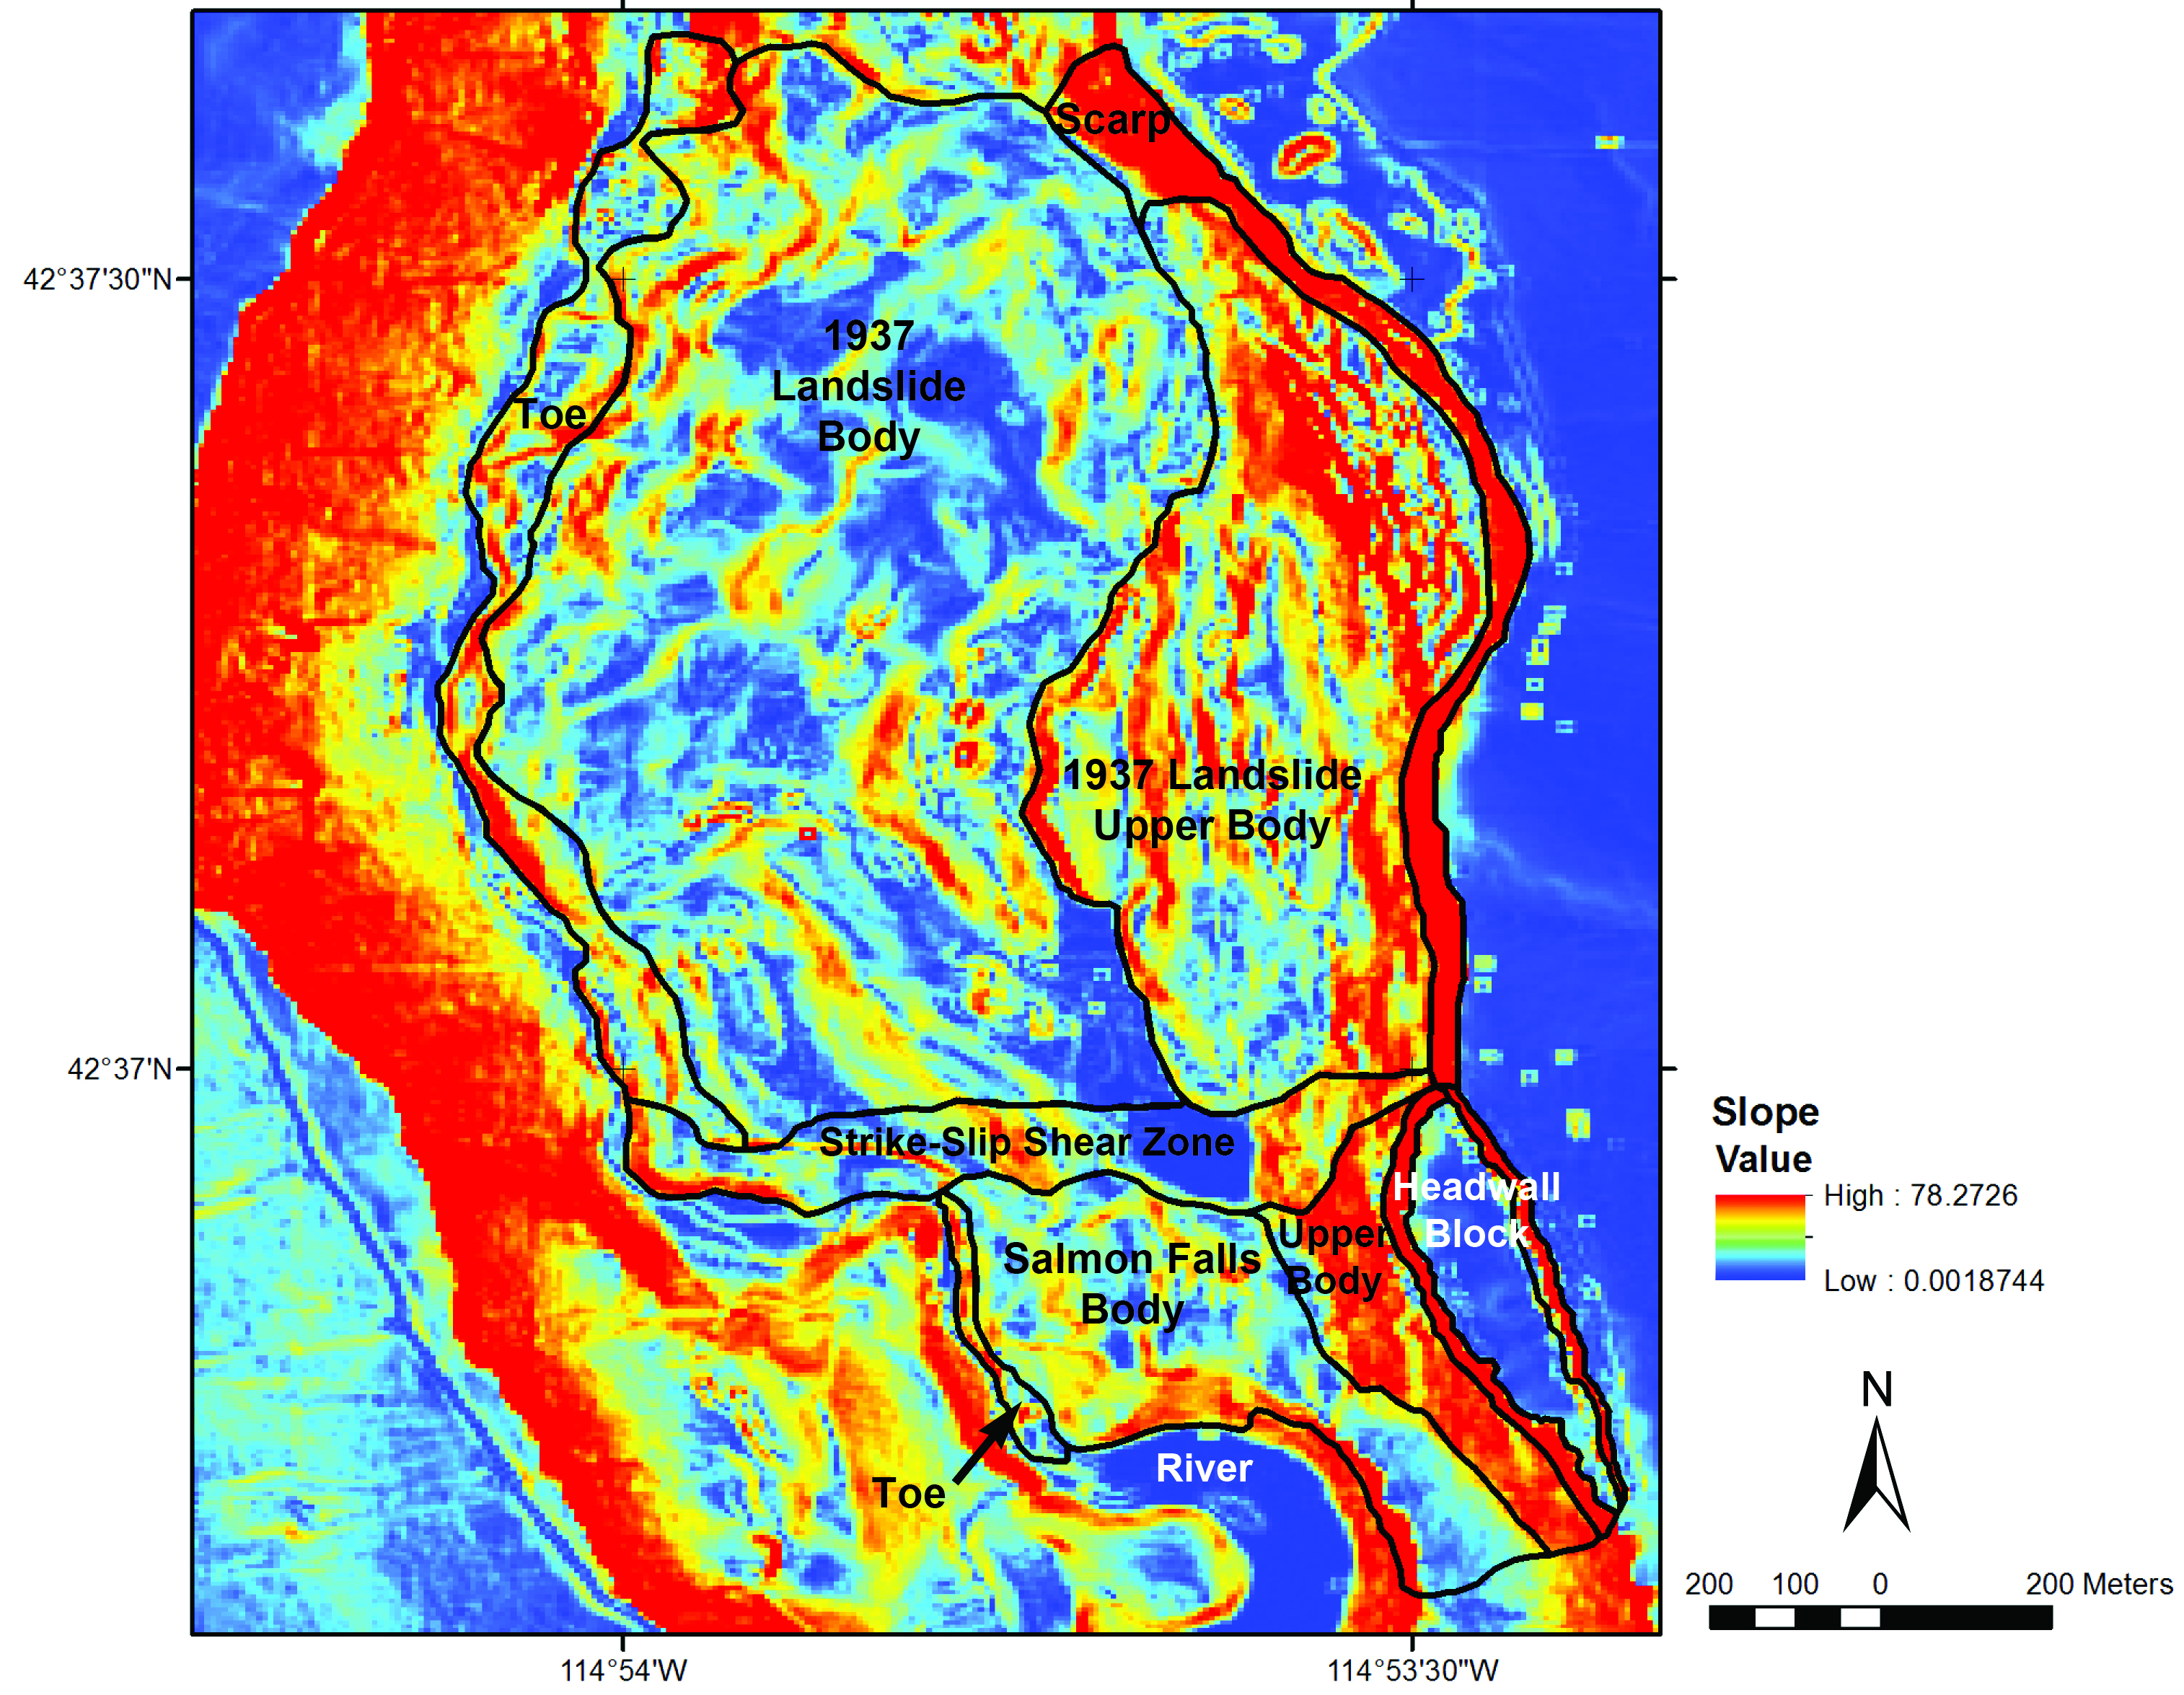
A slope map for the 1937 and Salmon Falls landslide complex shows greatest slopes in red, lowest in dark blue. Boundaries of the various geomorphologic units are displayed in black.
Conclusion
This study improved the understanding of the rate and extent of landslide movement in Salmon Falls Creek Canyon. The SwRI team proved the ability to estimate annual displacement rates accurately by analyzing a collection of archived radar satellite imagery using both SBAS and PS techniques, although, between the two, SBAS techniques appeared to perform better than PS techniques when it came to estimating non-linear displacement rates. Overall, the displacements measured using InSAR-derived techniques showed agreement with on-site GPS field measurements. Thus the research shows that radar imagery analysis is a reliable, low-cost alternative for monitoring earth movement and predicting landslides in high-risk areas.
Questions about this article? Contact SwRI Solutions.
Source: Information contained in this story can be found in “New Insights on the Salmon Falls Creek Canyon Landslide Complex Based on Geomorphological Analysis and Multitem-poral Satellite InSAR techniques,” Necsoiu M., R.N. McGinnis, and D.M. Hooper. DOI: 10.1007/s10346-014-0523-8, Landslides, Springer Berlin Heidelberg, Vol. 11, No. 6, pp. 1141–1153, 12/2014.
ACKNOWLEDGEMENTS
Satellite SAR data was provided by the WInSAR consortium; LiDAR data was provided by the courtesy of N. Glenn, Boise State University.