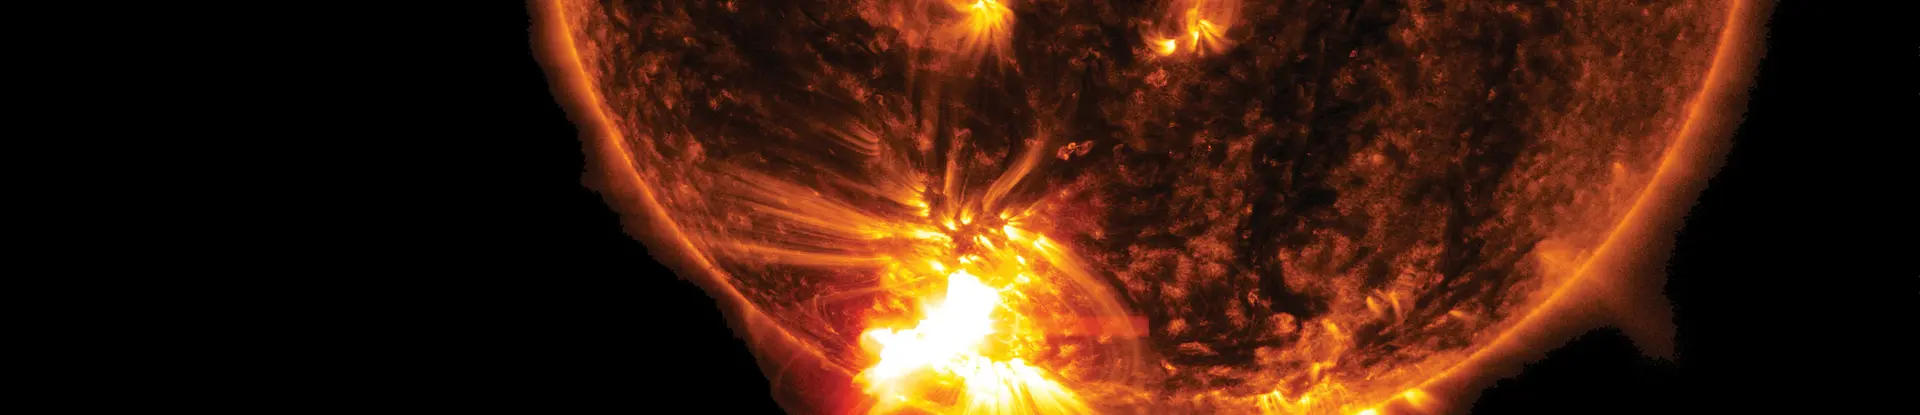
Shedding light on the solar corona
Just as it can be hard to pick out a single conversation in a noisy room, it can be difficult to isolate and refine a particular light signal in a light-saturated environment. Scientists wanting a clear image of the part of the Sun’s atmosphere known as the corona find it particularly challenging, because the Sun itself is so incredibly bright. A coronagraph, a telescope that masks the solar disk, solves part of the problem. However, ambient light from stars and background noise from the instrument itself have resulted in fuzzy imagery. Until now.
Using advanced algorithms and data-processing techniques, a team of scientists discovered never-before-detected, fine-grained structures in the outer corona. The corona is the source of the solar wind, a stream of charged particles that flow away from the Sun in all directions. Near the Earth, the solar wind is turbulent and gusty. But scientists have wondered how it gets that way. Does it leave the Sun smooth and become turbulent as it crosses the solar system? Or are the gusts telling us something about the Sun itself?
Answering this question requires observing the outer corona in extreme detail. If the Sun itself causes the turbulence in the solar wind, then it should be apparent right from the beginning of the wind’s journey. Previous images of the corona showed the region as a smooth, laminar structure. As it turns out, that apparent smoothness was due to a limitation in image resolution.

About the Author
Dr. Craig DeForest, a senior program manager in heliophysics, specializes in solar wind studies and matter-magnetic field interactions in the solar atmosphere. His experience includes instrument design and construction, observation planning and execution, data analysis, software development and theoretical studies. DeForest is an expert in signal processing and extraction, particularly image processing.
STEREO Analysis
To understand the corona, the Southwest Research Institute-led team started with coronagraph images from NASA’s Solar and Terrestrial Relations Observatory (STEREO) spacecraft. The STEREO mission consists of two identical spacecraft placed in two different orbits around the Sun. Two white-light coronagraphs, COR1 and COR2, are on board each spacecraft, to image the solar corona. In April 2014, STEREO-A would pass behind the Sun, and scientists wanted to grab some interesting data before communications went quiet.
During a special three-day data collection campaign, STEREO-A’s COR2 coronagraph took longer and more frequent exposures of the corona than usual. These long exposures allowed more time for light from faint sources to strike the instrument’s detector, collecting details it would otherwise miss. However, to make full use of the instrument’s optical resolution, the scientists needed still-deeper exposures than the instrument could support. With COR2 already in deep space aboard STEREO-A, the options were limited. Because they couldn’t tinker with the instrument itself, the scientists took a software approach, squeezing out the highest quality data possible by improving the data’s signal-to-noise ratio after the fact.
Separating Signals From Noise
The signal-to-noise ratio is an important concept in all scientific disciplines. It measures how well you can distinguish the thing you want to measure — the signal — from the things you don’t — the noise. While the Sun is quite bright, the corona is over a million times fainter — and it is seen against a bright background of dust and stars that must be removed digitally. In practice, coronal images have been limited by noise from this background, the space environment, and the intrinsic quantum noise that comes from counting individual electrons in each pixel of the camera. While COR2’s coronagraphs are optically capable of imaging the corona in great detail, in practice the noise limits the actual useful resolution of the images. Identifying and separating out that noise while boosting the signal-to-noise ratio has revealed the outer corona in unprecedented detail.
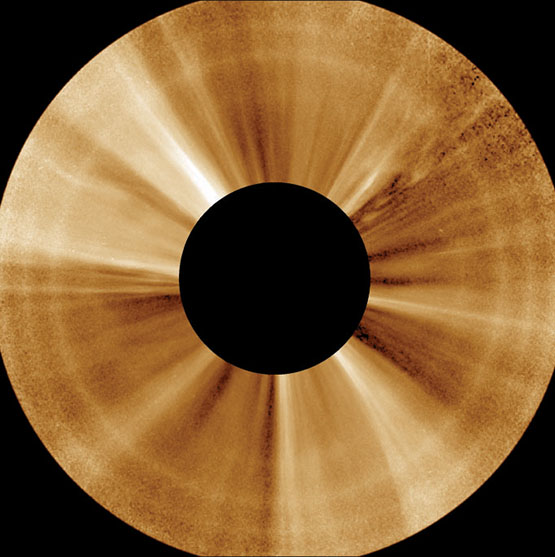
Image Courtesy of NASA/SwRI/STEREO

Image Courtesy of NASA/SwRI/STEREO
Conventional images of the Sun’s outer corona (left) lack detail. But the corona is not laminar and smooth as previously thought. Newly applied noise-reduction techniques reveal a surprisingly dynamic and structured outer corona (right).
Gathering longer-exposure images was the first step in improving the signal-to-noise ratio. Longer exposures allowed more light into the detector and reduced the noise level — the team estimates noise reduction by a factor of 2.4 for each image, and a factor of 10 when combining them over a 20-minute period. The remaining steps used sophisticated algorithms designed to extract the true corona from the noisy data. They filtered out light from stars creating bright spots in the image that are not part of the corona. They corrected for millisecond differences in how long the camera’s shutter was open. They removed the baseline brightness from the images and normalized it so brighter regions wouldn’t wash out dimmer ones. But the most challenging obstacle was inherent to the corona itself: the motion blur associated with the supersonic solar wind. To overcome this issue, the team borrowed a technique from other scientific disciplines to create an algorithm to smooth the data over time.
Data Double Take
If you’ve ever done a “double take,” you are familiar with how the scientists performed smoothing over time. A double take — taking a second glance to verify your first one — is just a low-tech way of combining two pictures or measurements taken at different times into one higher confidence measurement. Scientists turned this smoothing across time into an algorithm. The principle is simple: take two (or more) images, overlap them and average their pixel values together. Random differences between the images are cancelled out, leaving behind only what is consistent.
But when it comes to the corona, there’s a problem: It’s a dynamic, persistently moving and changing structure. Solar material is always streaming away from the Sun and becoming the solar wind. Smoothing in time would create motion blur — the same kind of blurring seen in photographs of moving objects. If the goal is to see fine detail, blur is a problem.
To remove the motion blur from the solar wind, the SwRI scientists tried a new approach: While they did their smoothing, they estimated the speed of the solar wind and shifted the images along with it. To understand how this works, think about taking snapshots of the freeway as cars drive past. If you simply overlapped your images, the result would be a big blurry mess — too much has changed between each snapshot. But if you calculated the traffic speed and shifted your images accordingly, suddenly the details of specific cars would become visible. For the sake of comparison, the cars are the fine-scale structures of the corona, and the freeway traffic is the solar wind.
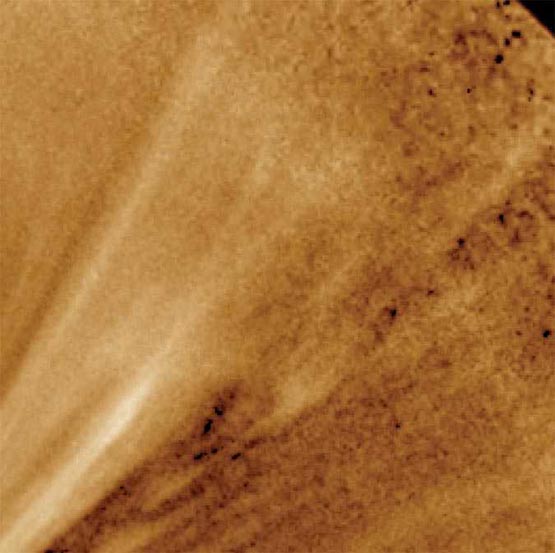
Image Courtesy of NASA/SwRI/STEREO
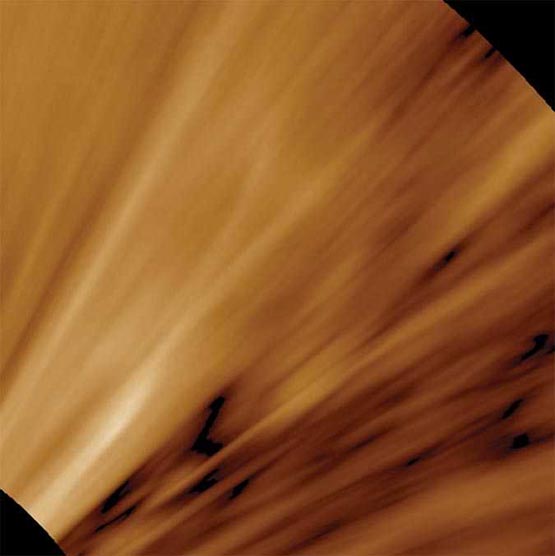
Image Courtesy of NASA/SwRI/STEREO
An SwRI-led team developed novel astrophysical processing techniques and applied them to extra-long exposures of the solar corona collected by NASA’s STEREO-A spacecraft (left/top) to bring this hard-to-image region into sharp focus (right/bottom).
Of course, first you need to determine how fast things are moving. To figure out exactly how much to shift the images before averaging, the team scooted the images pixel-by-pixel, correlating them with one another to compute how similar they were. Eventually they found the sweet spot, where the overlapping parts of the images were as similar as possible. The amount of shift corresponded to an average solar wind speed of about 140 miles per second. Shifting each image by that amount, they lined up the images and averaged them together in a moving space-time coordinate system.
Now the team had high-quality images of the corona and a way to tell how much it was changing over time. The most surprising finding wasn’t a specific physical coronal structure — it was the presence of the intricate physical structure in and of itself. Compared with the dynamic, turbulent inner corona, scientists had thought the outer corona was smooth and homogenous. But that smoothness was just an artifact of poor signal-to-noise ratio. After removing as much noise as possible, the SwRI-led team realized that the corona contains structure all the way down to the optical resolution of the instrument. Like the individual leaves on a tree visible only up close, the scientists unveiled complex physical structure in unprecedented detail. And from that physical detail, three key findings emerged.
DETAIL
The theoretical Alfvén surface, named for noted plasma physicist Hannes Alfvén, was thought to be a specific boundary between the outer solar corona and interplanetary space.
Structured Streamers
One finding involves coronal streamers, bright structures that develop over regions of the Sun with enhanced magnetic activity. Readily observed during solar eclipses, magnetic loops on the Sun’s surface are stretched out to pointy tips by the solar wind and can erupt into coronal mass ejections, or CMEs. These large explosions of matter eject solar particles into surrounding space. The team’s observations revealed that streamers are far more structured than previously thought. There is no such thing as a single streamer. Rather, they are composed of myriad fine strands that together produce the bright feature.
Surface VS Zone
The next finding addressed theories about where the corona ends and the solar wind begins. Previously, scientists theorized that this took place at the “Alfvén surface.” This theoretical boundary is where, once solar materials pass, they can no longer affect the corona directly. Physicists have long believed this surface, or sheet-like layer, was where the accelerating solar wind smoothly passed a critical speed and separated from the Sun. However, the new images reveal that there isn’t a clean Alfvén surface. The observations reveal a patchy framework where some plasma is moving fast enough to stop “backsliding,” while nearby streams are not. The streams are close enough, and fine enough, to create a partially disconnected region between the corona and the solar wind. The team now refers to this wide “no-man’s land,” where the solar wind gradually disconnects from the Sun, as the “Alfvén zone.”
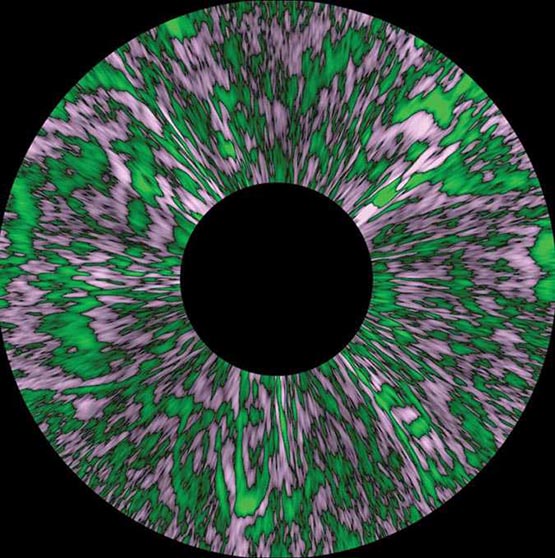
Image Courtesy of NASA/SwRI/STEREO
The SwRI-led team processed solar coronal images to reveal universal gusts, jets and streams (green) emanating from the Sun, offering a possible explanation for the gusty solar wind found around Earth.

Image Courtesy of NASA/SOHO
These coronal streamers, observed by the Solar and Heliospheric Observatory (SOHO) spacecraft, are actually composed of many individual fine strands.
Enigma at 10 Sola Radii
And finally, in addition to answering some questions, this new view of coronal structures also raised new questions. The technique used to estimate the speed of the solar wind pinpointed the altitudes, or distances from the Sun’s surface, where things changed rapidly. And that’s when the team noticed something peculiar. At a distance of 10 solar radii, even back-to-back images stopped matching up well. But they became more similar again at greater distances — meaning that it’s not just about getting farther from the Sun. It’s as if things suddenly change once they hit 10 solar radii and then realign again at a distance. This suggests some interesting, unexpected physics at play.
What's Next?
The findings made headway in a long-standing debate over the source of the solar wind’s complexity. While the observations don’t settle the question, the research identified a missing link in the Sun-to-solar-wind chain. Knowing that the solar wind is variable as it hits the Earth’s magnetosphere, scientists have wondered if it is possible that the variability could be traced back to the Sun. It turns out the answer could be yes. The new images allowed the team to explore the connectivity through the corona and compare how tangled the magnetic fields get in the corona versus the solar wind.
These first observations also provide key insight into what NASA’s Parker Solar Probe — which launched August 12 — will encounter. The spacecraft will be the first-ever mission to gather measurements from within the outer solar corona. Based on these new data, the probe should encounter steep density and magnetic fluctuations, explosive reconnection events and no well-defined Alfvén surface.
Combining these new imaging techniques with Parker Solar Probe’s in situ measurements could revolutionize our understanding of the Sun, our closest star.
Visit Heliophysics for more information or contact Craig DeForest at +1 303 541 9084.
ACKNOWLEDGEMENT
The author acknowledges the contributions of Miles Hatfield from NASA’s Goddard Space Flight Center to this feature.