
Background
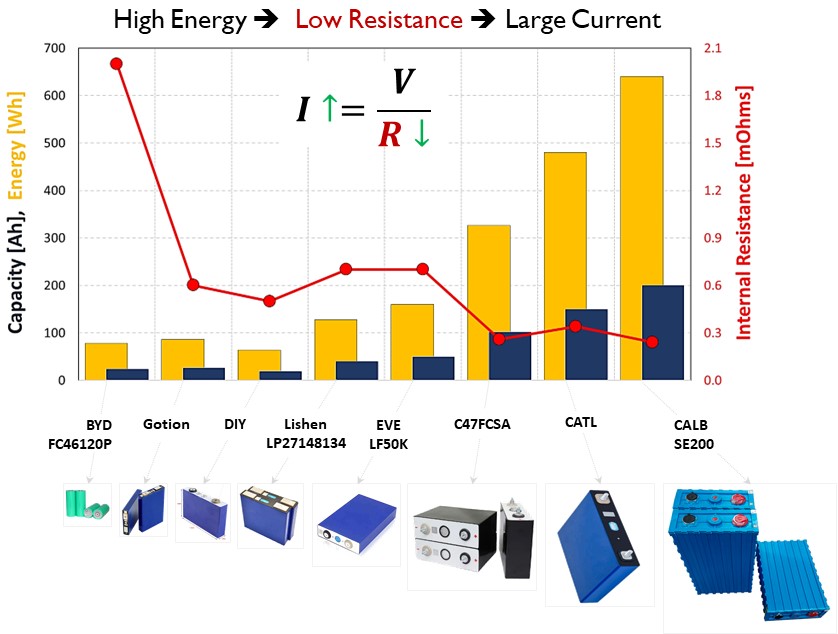
Figure 1. Energy and internal resistance relation for large lithium-ion batteries.
Electric vehicle (EV) manufacturers are increasingly focusing on high-capacity batteries to alleviate range anxiety. While larger batteries offer several advantages, they also come with increased weight and size, and a lower internal resistance, see Figure 1. Resistance is directly related to the number of pathways available for current and Li-ions to flow within the battery. As batteries age, internal resistance tends to increase, which can serve as an early indicator of potential performance issues. Characterizing batteries with a low internal resistance (less than 1 mOhm) requires substantial electrical currents and a large power source. Furthermore, the presence of bus bars and welding interfaces introduce additional complexities, making it difficult to accurately assess the battery internal resistance. Innovative testing and analytical methods for sub-milliohm batteries are needed to address these challenges. By developing more precise and efficient measurement techniques, researchers and engineers can gain a deeper understanding of battery performance, optimize charging strategies, and improve the reliability and longevity of EVs.
Approach
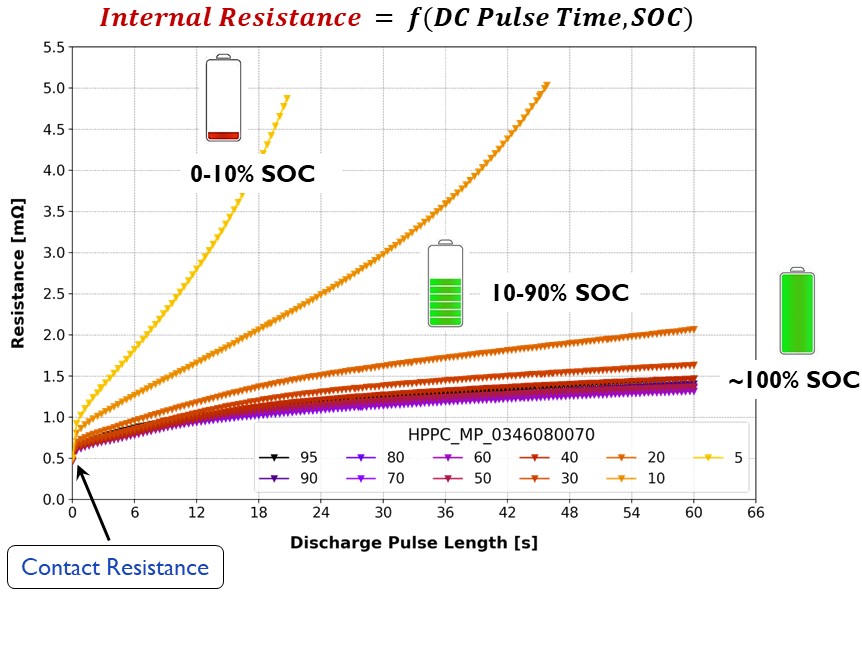
Figure 2. Internal resistance variation as a function of pulse length and SOC.
Conventional time-domain methods to measure internal resistance were tested. Various triggering methods, including pulse, ramp, and other nonlinear techniques, were evaluated, and compared to assess their suitability for application in large-scale batteries, see Figure 2. The goal was to establish a repeatable measurement methodology that operates within the constraints of available equipment. The effect of various cell metrics, including resistance, capacity, impedance, and polarization time constants was investigated. Frequency-domain techniques, such as Electrochemical Impedance Spectroscopy (EIS), were carried out to calibrate equivalent circuit models (ECMs) associated with each cell, see Figure 3. The battery impedance dependency on state of charge (SOC) and frequency was assessed. The challenge was deconvoluting the cell mechanisms and computing the terminal connections contribution on the impedance response.
Accomplishments

Figure 3. Nyquist plot showing impedance response at different state-of-charge and frequency.
Evaluation of DC & AC Pulse Methods: The analysis encompassed a wide variety of cell formats, chemistries, terminal designs, and sizes, ensuring a comprehensive understanding of the technology. Seven representative battery models were selected as test samples based on this analysis. Direct current (DC) pulse methods reported on the technical literature were experimentally evaluated. DC pulse methods for measuring battery internal resistance showed consistent results: high resistance at full charge/discharge, low resistance in between. Pulse length time influenced apparent resistance variation across different methods. The study on alternate current (AC) pulse methods investigated the impact of factors like frequency and SOC on the impedance response of lithium-ion batteries. Results demonstrated that SOC significantly influences impedance, particularly when the cell is near a fully charged or fully discharged state.