
Background
The field of data analytics, especially when combined with the visualization of large datasets, has the potential to reveal insights that are often hidden in traditional data reviews. This growing business area spans multiple sectors, including transportation, the environment, and space sciences. However, the adoption of existing tools is hindered by their inability to efficiently highlight relevant insights, high licensing costs, and performance issues with large datasets, resulting in barriers to adoption. This research created a toolkit for custom visualizations that can identify correlations across diverse datasets.
Approach
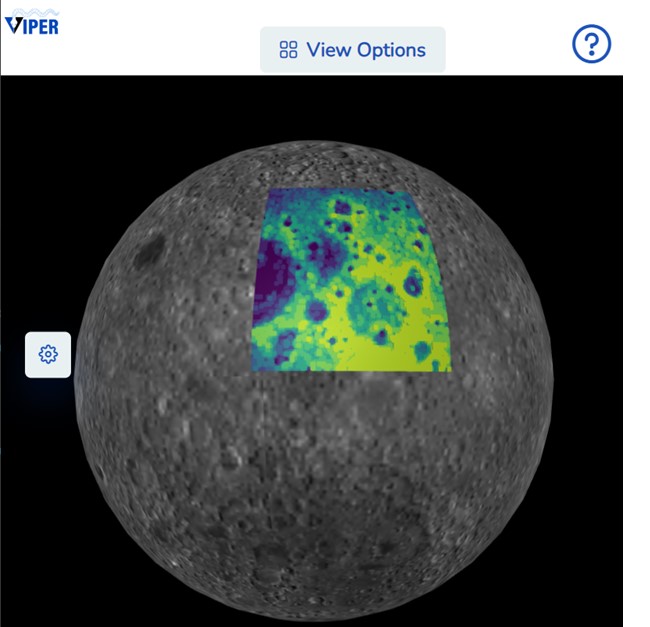
Figure 1: Lunar visualization.
This project focused on creating an extensible, cross-platform tool for analyzing and visualizing geolocated data, facilitating data analysis and comparison of data sources. Initial visualizations were created in the transportation domain and included connected vehicle, travel times, incident, and work zone data Subsequently, we applied this toolset to two other domains: city demographics alongside environmental data and lunar data for space science. A pivotal challenge was navigating TIFF files with embedded data for city and lunar domains, requiring new methods to extract and allow filtering of this information. This diversification underscores the toolset’s adaptability and support for a wide data variety without domain-specific constraints.
Accomplishments
Incorporating data from these varied domains, the toolset produced visualizations that facilitate exploration of dataset correlations The application enables data mapping and user-defined filters, providing customizable data insights. Examples of custom transportation visualizations include exploration of the correlations between connected vehicles and roadside device data, travel time comparisons, and incident and work zone mapping. Visualizations from other domains include city demographic data combined with environmental indices like heat levels, and lunar maps highlighting features such as topography or brightness. Additionally, the application supports user-generated data uploads for further customizable analyses, enhancing accessibility and insight generation across multiple fields.