
Background
The project was undertaken to capitalize on a collaboration opportunity with a new research group and add a new capability to the PlanetCARMA microphysics model. Beginning in December 2010, the Cassini spacecraft observed a giant storm in Saturn’s atmosphere. The 2010 storm disrupted Saturn’s normal seasonal cycle between 20° N and 50° N, causing noticeable changes in temperature, winds, and composition, which persisted until 2014. Analysis of Herschel Space Observatory data taken between 2011 and 2013 showed a dramatic increase in water vapor in Saturn’s stratosphere that was hypothesized to be indirect evidence of water ice particles in this region – i.e., the temperature increases from Saturn’s great storm caused water ice sublimation which then increased the abundance of water vapor. As I have a Saturn version of my PlanetCARMA microphysics model, the group contacted me about the possibility of providing simulations to support their conclusion.
Approach
The project objective was to create a mechanism for physically stepping through externally driven temperature changes in the PlanetCARMA column microphysics model and use this to simulate the sublimation of water ice in Saturn’s atmosphere. I obtained a set of temperature profiles from Cassini CIRS (infrared spectrometer) data ranging from mid-2010 to spring-2012 covering the region of Saturn’s atmosphere impacted by the storm. I adjusted the Saturn main program in the PlanetCARMA code to interpolate between the temperature data files for each timestep, sending these temperature profiles into the microphysics calculations. I first ran a steady-state simulation, fixing the temperature profile to the mid-2010 (pre-storm) environment to allow the code to form a population of water ice particles. Then I rewrote the restart code to import these ice particles and ran the code stepping through the entire span of the temperature data files to observe the effects on the size and abundance of the ice particles.
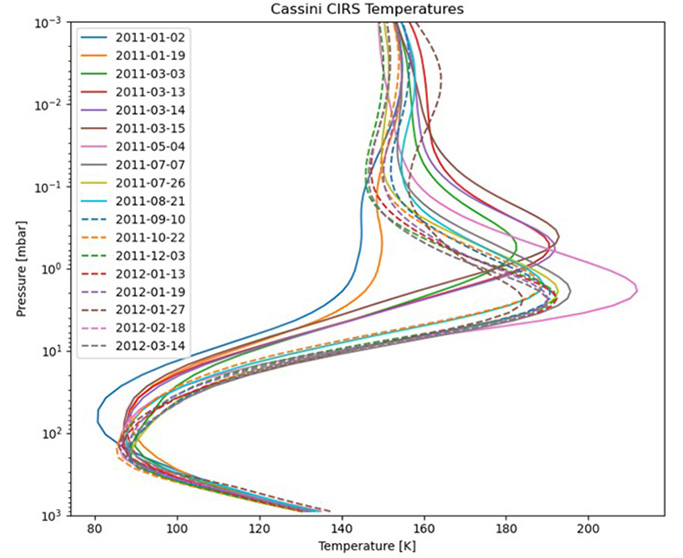
Figure 1(a): Series of 18 Cassini CIRS derived temperature profiles loaded into PlanetCARMA to simulate the effects of temperature changes caused by Saturn’s 2010 great storm.
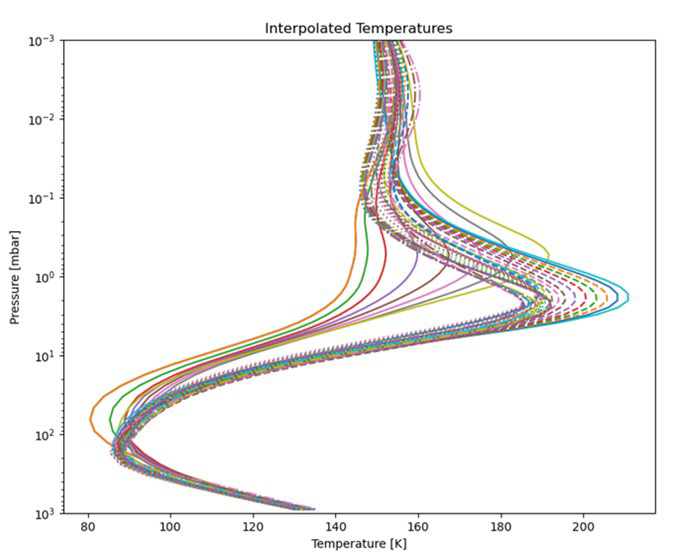
Figure 1(b): CARMA-interpolated temperature profiles over the time range of the CIRS observations. Curves are shown at a 10-day output frequency, but the model interpolates them over the model timestep of 60 seconds.
Accomplishments
The PlanetCARMA code can now ingest data files of atmospheric temperature profiles and interpolate between them to drive the microphysics calculations over a changing environment – this differs from the previous way the code was run, to steady-state simulations in a fixed-temperature environment. This allows the code to simulate with more realism when interpreting or reproducing observations of planetary atmospheres. Even though this project was specific to modeling Saturn’s atmosphere, the versatility of PlanetCARMA allows the technique to be applied to any of the other (nine) planetary atmospheres included in the model.
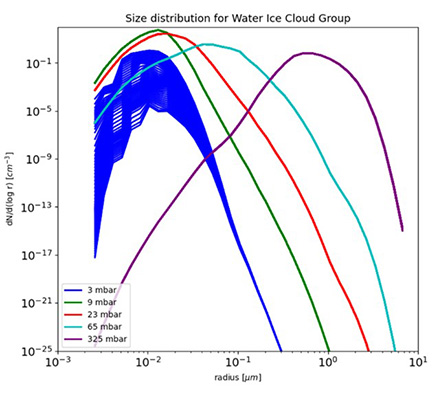
Figure 2(a): Changes in the ice particle size distributions over the course of the model run. Ice particles exist down to the 1 bar pressure level, but changes over time are only seen in the shallower pressure levels where the temperature changes are more intense.
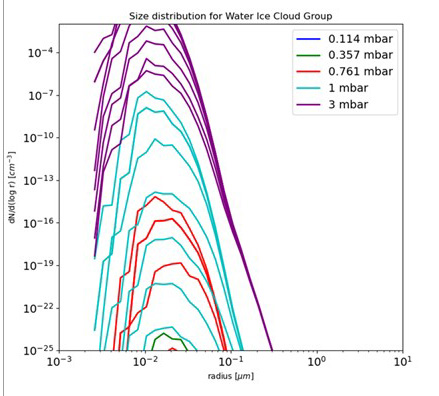
Figure 2(b): Changes in the ice particle size distributions over the course of the model run. Decrease in ice particle population between 0.1 and 3 mbar as shown by size distributions overplot for a range of output times.
Publications
Lefour, C., Cavalié, T., Feuchtgruber, H., Moreno, R., Fletcher, L. N., Fouchet, T., Lellouch, E., Barth, E., Hartogh, P. (2025). “Observations of the temporal evolution of Saturn's stratosphere following the Great Storm of 2010–2011: I. Temporal evolution of the water abundance in Saturn's hot vortex of 2011–2013.” Astronomy & Astrophysics, Volume 698, id.A66, 20 pp.