
Background
Traditional deep learning models are known to be biased black boxes, due to training data diversity and chosen complexity of the model. Therefore, the ability for models to produce explainable, human-interpretable output is becoming increasingly desired and explored, especially in computer vision tasks. This research focused on a component of explainability: Uncertainty Quantification (UQ) applied to semantic segmentation. UQ techniques identify parts of an image where the model tends to perform worse than expected, enabling informed decision-making by an automated platform or other entity receiving the information. Therefore, UQ techniques may improve performance and greater prediction accuracy.
Approach
The research had two main objectives. First, UQ was implemented with a baseline semantic segmentation model to prove validity. This was accomplished by utilizing Monte Carlo dropout to simulate Bayesian inference, as seen in Figure 1. By introducing dropout layers to a SegNet deep learning model and then passing in the same input multiple times, the network now outputs a distribution of output semantic maps, rather than just one output. From this output, one can generate an uncertainty map via the variance of each pixel across all maps, to get a per-pixel estimation of uncertainty across the image. Afterwards, UQ was implemented on a more modern semantic segmentation model (UNet) to show transferability, as well as to demonstrate the inverse relationship between uncertainty and accuracy between models.
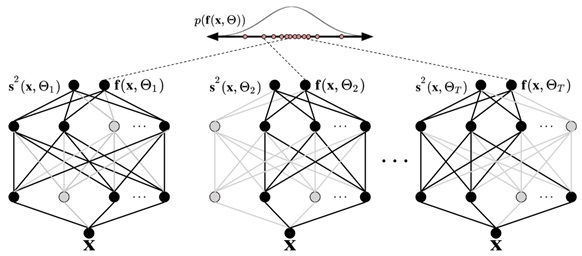
Figure 1: Monte Carlo Dropout implemented on a feedforward neural network. Notice that the output of the network is now a distribution of classifications, rather than a single prediction.
Accomplishments
These efforts resulted in two semantic segmentation networks capable of communicating levels of uncertainty in their respective outputs. These uncertainty maps can be compared in Figure 2. After conducting proper model validation on both models, the researchers were able to determine that not only does the UNet model have a higher prediction accuracy than the SegNet model, but the UNet model also has less uncertainty in its predictions.
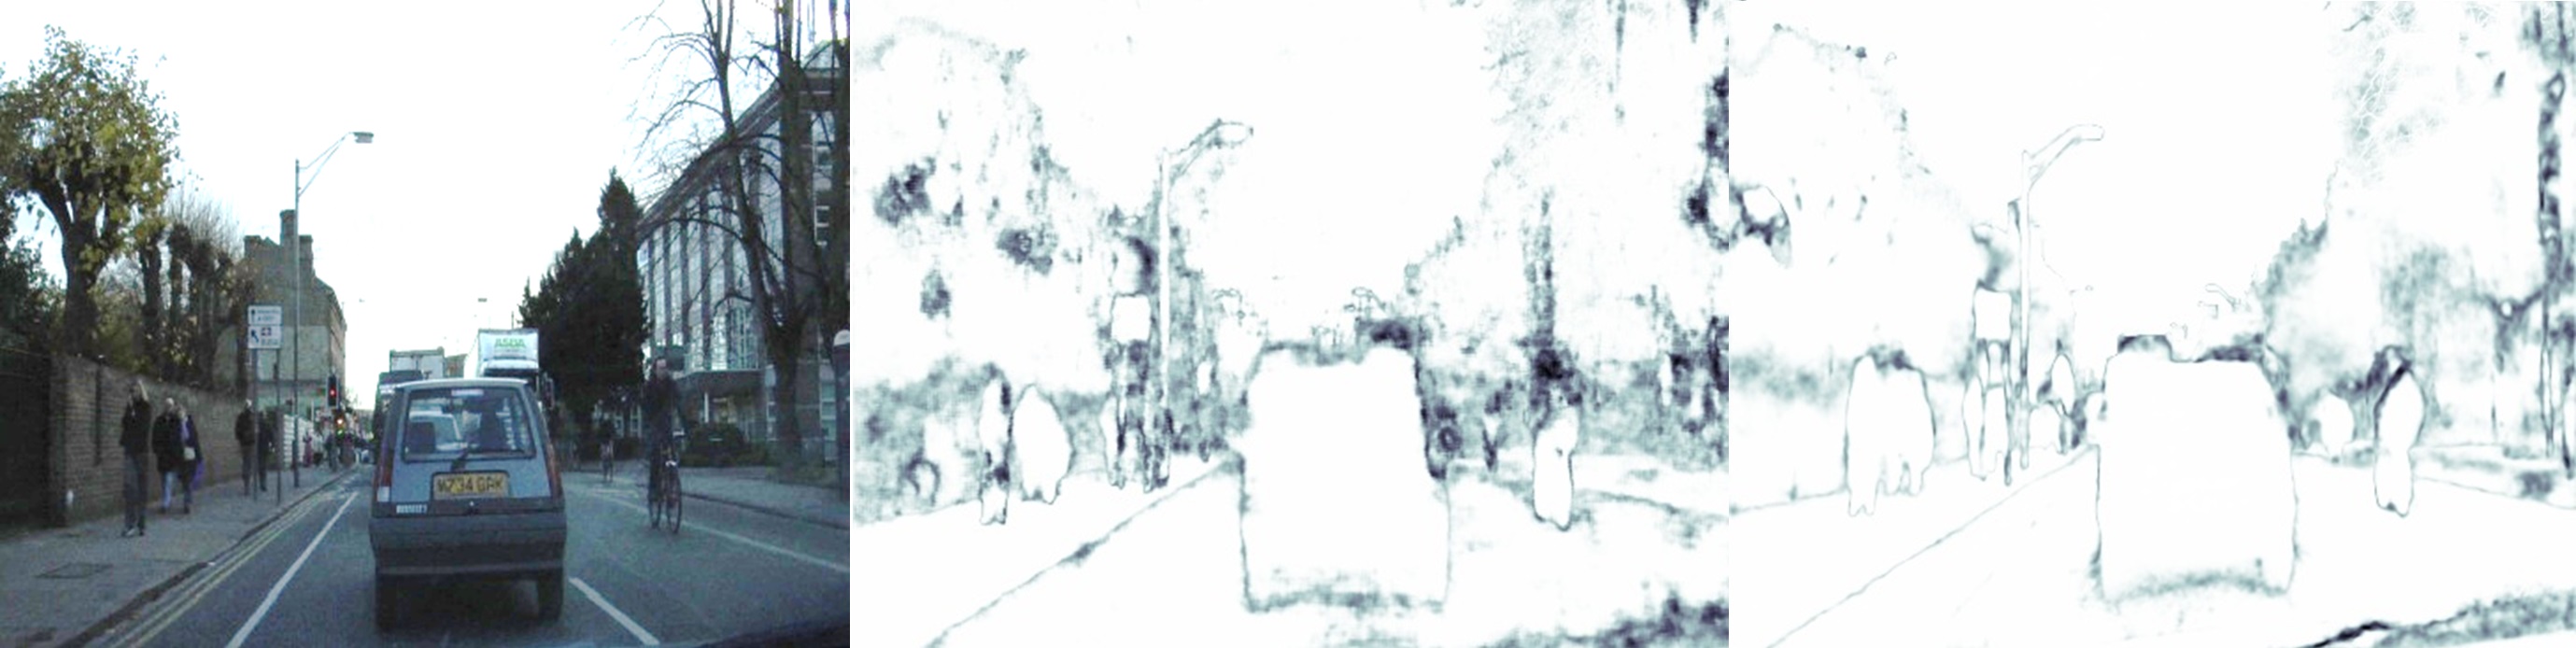
Figure 2: The given input image (left) resulted in a SegNet uncertainty map (middle) and a UNet uncertainty map (right). The UNet uncertainty map has quantifiably less overall uncertainty than that of the SegNet uncertainty map.