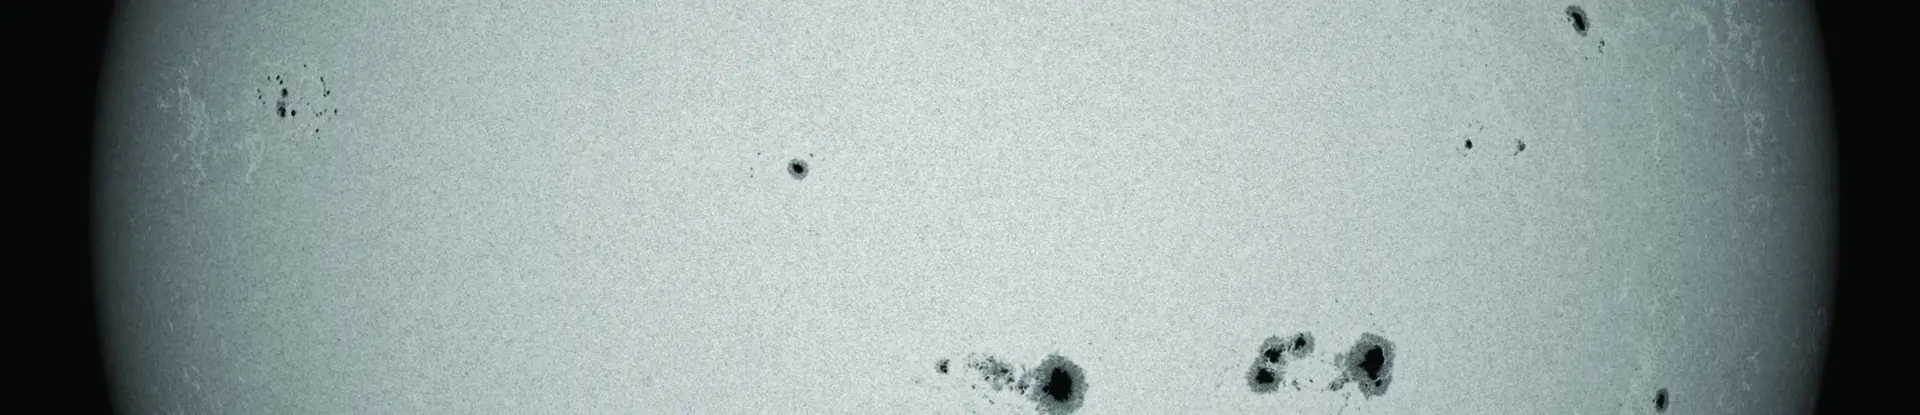
Although space scientists have only been able to directly measure the Sun’s solar wind since the Space Age began a little over 50 years ago, astronomers more than four centuries ago were already viewing the Sun and recording the appearance of dark areas, or “sunspots,” on the solar surface. Over time they recognized that sunspot activity seemed to increase and decrease according to a cycle from “solar minimum” to “solar maximum” and back to minimum again, approximately every 11 years. Their increasingly accurate record of sunspots over the solar cycles remains useful to solar and space scientists today.
As knowledge of the Sun has continued to build, scientists have learned that the Sun constantly emits a continuous million mile-per-hour stream of charged particles, known as the solar wind. This solar wind inflates a “bubble” in space known as the heliosphere encompassing the solar system’s planets. The solar wind was first directly measured by a Soviet spacecraft in 1959, with essentially continuous observations available largely from NASA spacecraft since the 1960s.
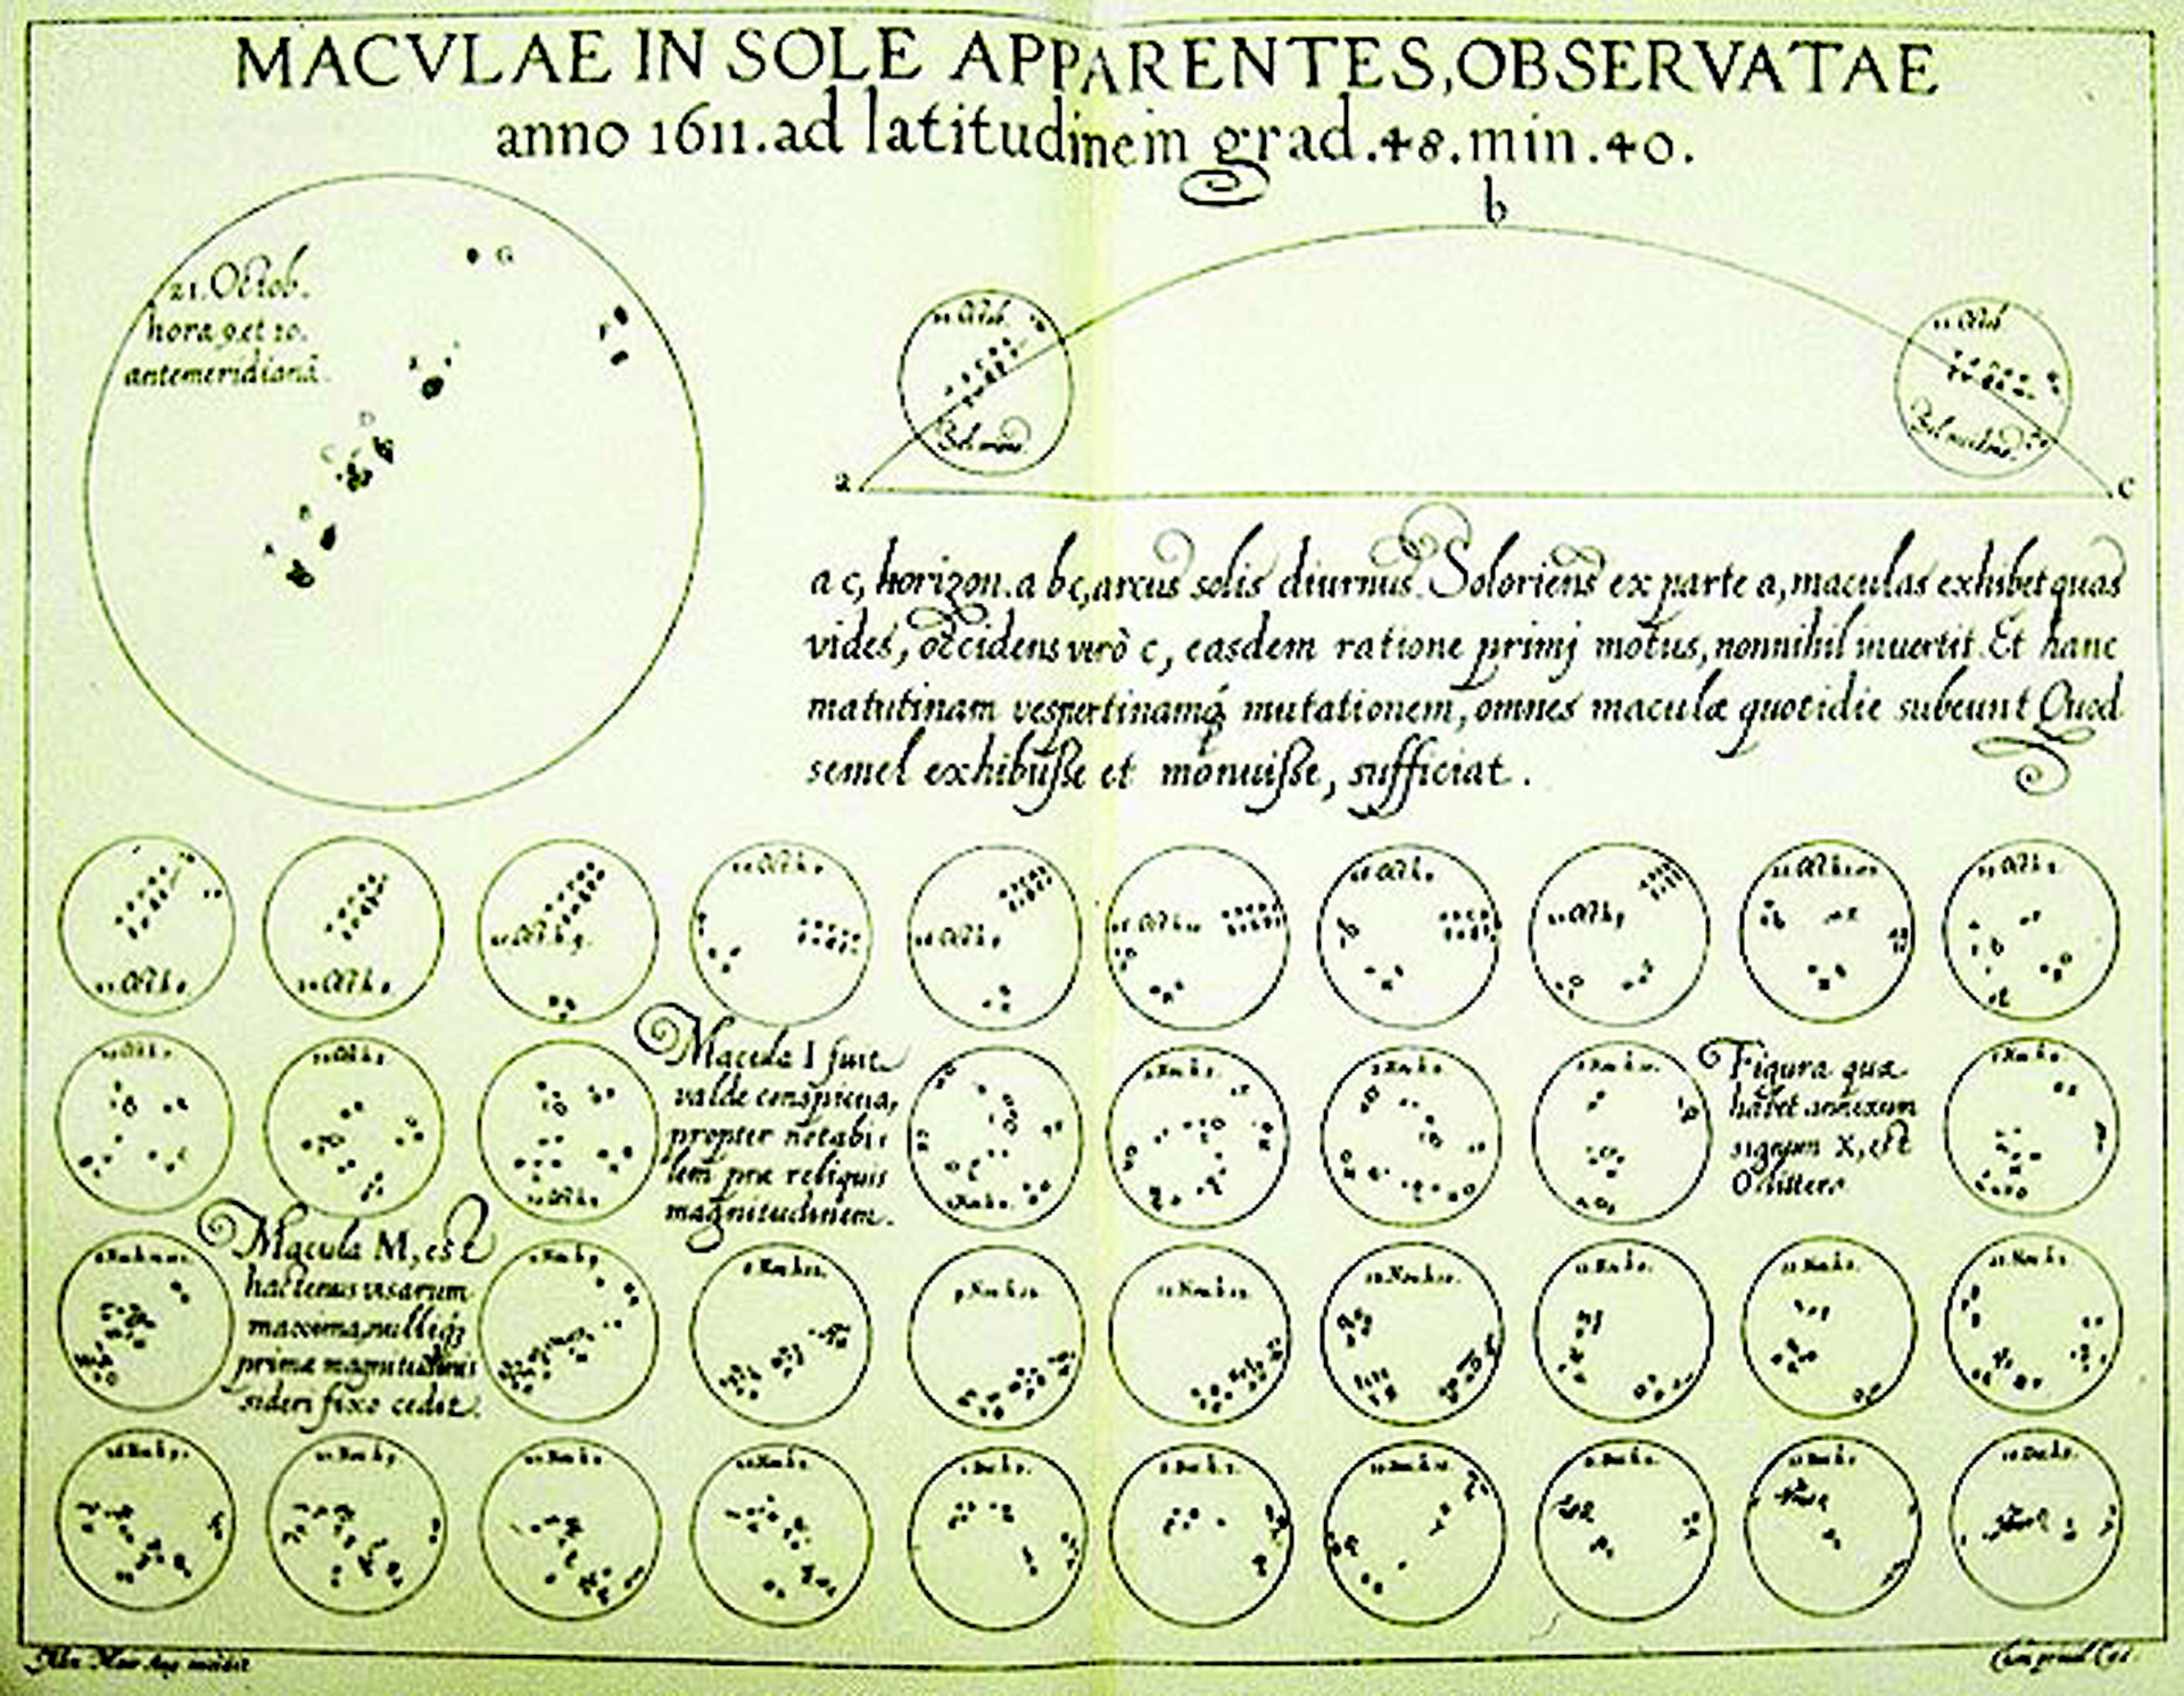
This sunspot map was created by German astronomer Christoph Scheiner around 1611.
Meanwhile, sunspots are recognized today as regions of intense magnetic activity on the Sun. Some of these regions are associated with coronal mass ejections, or CMEs. CMEs are huge eruptions of electromagnetic energy from the corona, the superheated region area above the Sun’s surface that is observable during eclipses. CMEs hurl some of the matter that makes up the Sun toward Earth and the other planets, often even faster than the already supersonic solar wind. Thus, space-age observations using in-situ solar wind measurements from space along with remote observations of the Sun have helped space physicists gain a much clearer understanding of the link between sunspots and those coronal mass ejections that collide with Earth’s own magnetic field and create intense space weather events and stunning aurora borealis.
This in-situ knowledge helps today’s scientists better understand the centuries-old observations of solar cycles. Over the most recent decade, scientists at Southwest Research Institute (SwRI), in collaboration with colleagues from a variety of other institutions, have noted an unexpected development. Associated with the unusually long most recent solar minimum and surprisingly low solar activity in the ongoing “mini” solar maximum, they observed the weakest solar wind of the space age.

Dr. David McComas is assistant vice president of SwRI’s Space Science and Engineering Division. He is principal investigator for NASA’s Interstellar Boundary Explorer (IBEX) and Two Wide-angle Imaging Neutral-atom Spectrometers (TWINS) missions, and for the solar wind instruments onboard the Ulysses and the Advanced Composition Explorer (ACE) spacecraft. Those instruments produced much of the data in this article. He is author of more than 500 refereed publications and recipient of the 2014 COSPAR Space Science Award, recognizing outstanding contributions to space science.
The recent deep solar minimum and “mini” maximum
The last solar minimum, which extended into 2009, was especially deep and prolonged compared to previous solar cycles. Since then, sunspot activity — which would have been expected to rise toward a new peak— has instead gone through a very small peak of only about one-third the number of most recent cycles, even as other cyclical heliospheric behaviors, such as the tilt of the heliospheric electrical current sheet (which is greatest at the peak of the solar cycle and flattest at its minimum) were similar to what was seen in prior solar maxima. Compared to values typically observed from the mid-1970s through the mid-1990s, the solar wind output was, on average, dropping through the extended solar minimum and remained more than one-third lower in many key parameters during the mini solar maximum from 2009 and into 2013.
A weaker solar wind
Routine solar wind observations since the 1960s have led to essentially continuous measurements of the solar wind and its embedded interplanetary magnetic field. The SwRI team’s study of data gathered by NASA’s Ulysses spacecraft, launched in 1990 for an intended single six-year polar orbit around the Sun but whose mission eventually provided information from three solar orbits over nearly two decades, showed that the fast solar wind in the third orbit was slightly slower and cooler than the first orbit and had significantly lower density, mass flux and momentum flux. Other studies from Ulysses also showed that the magnetic field that extends out from the Sun’s polar coronal “holes” and is associated with the fast wind was aboutone-third weaker in the third orbit compared to its first orbit.
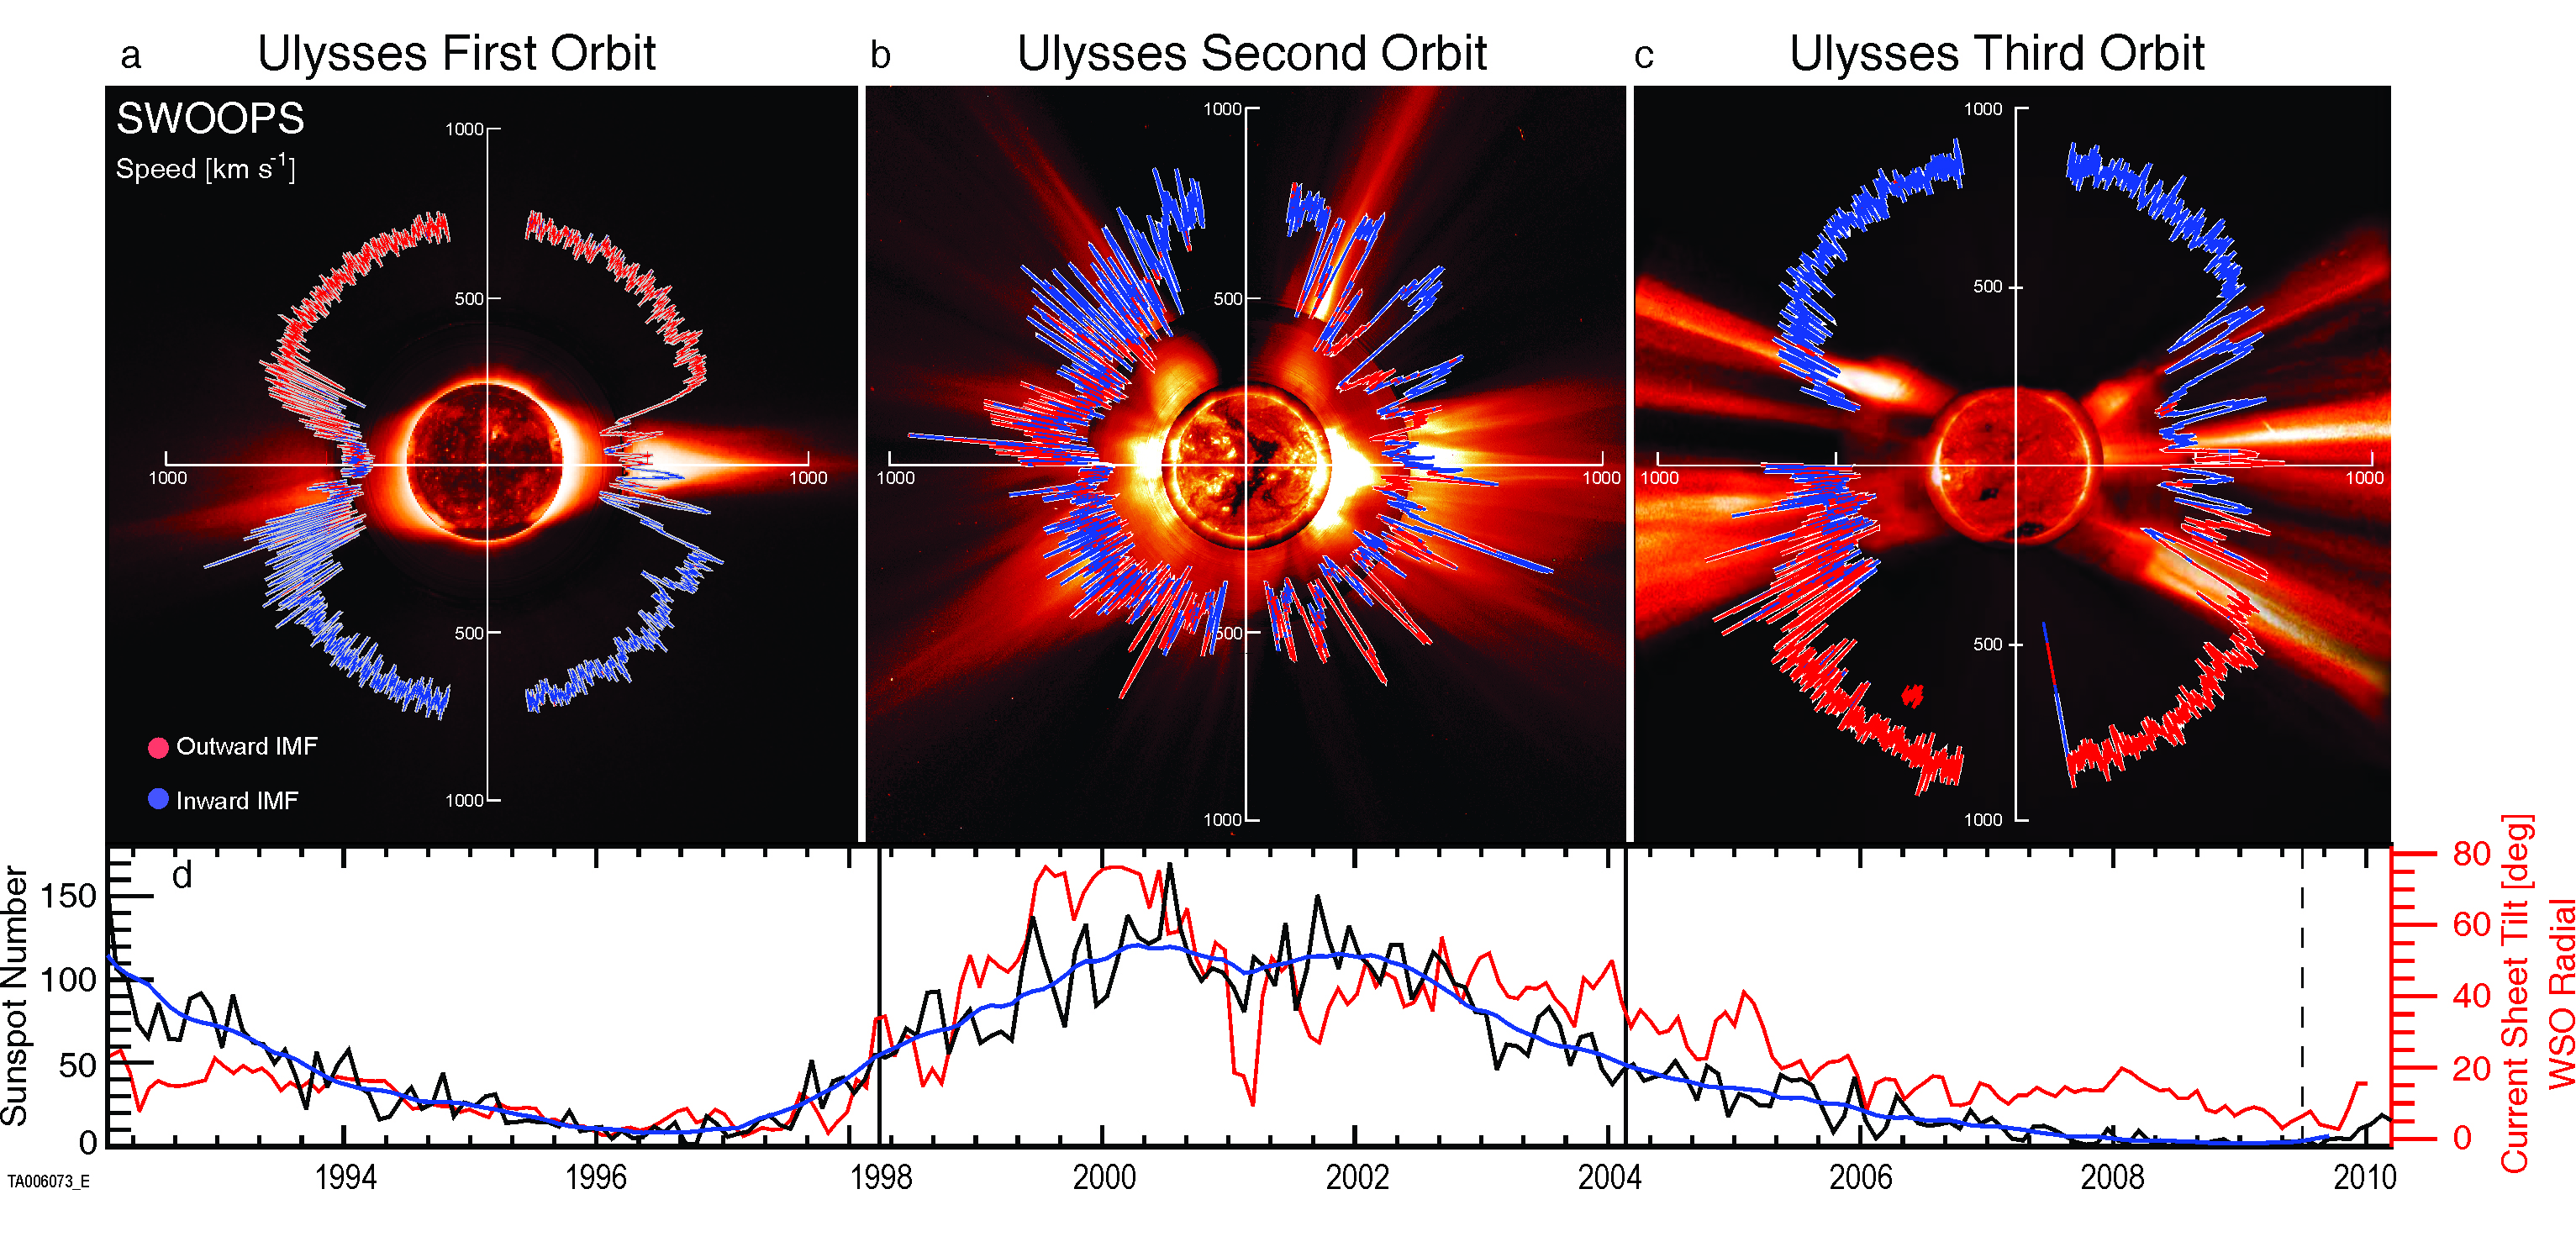
The Ulysses spacecraft measured solar wind speed (red and blue lines in radial plots) overlaid on typical coronal images for the different epochs and comparing to the sunspot numbers and current sheet tilt across the bottom of the panel.
Overall, the studies showed that the recent extended solar minimum consistently produced the lowest solar wind output from the Sun since continuous and well-intercalibrated observations began in 1974, and likely over the entire Space Age. This output marked some of the lowest non-transient solar wind densities, proton temperatures, dynamic pressures and interplanetary magnetic field strengths ever observed.
The question of what causes the reduction of solar wind output through the last solar minimum and into the current solar maximum requires insights into the evolution of the coronal environment. Based on charge-state data from the Ulysses and ACE (Advanced Composition Explorer) spacecraft, the corresponding reduction in solar wind particle flux and solar wind power is likely associated with lower electron temperatures down in the corona.
One model useful in understanding solar behavior is the “solar wind scaling law” developed by two SwRI space scientists in 2003. The law shows that cooler coronal electron temperatures are naturally associated with lower solar wind particle fluxes during the protracted solar minimum, because downward heat conduction must be reduced to keep the average energy loss per particle fixed. Results of the scaling law suggested that the evolution of the solar wind is linked to the Sun’s internal dynamo, which produced a weaker coronal magnetic field during the deep, extended solar minimum. The law was used to project coronal electron temperatures backward in time throughout the space age and found that while these coronal temperatures had been increasing in successive temperature maxima from 1969 to 1987, since then they have been decreasing in successive maxima.
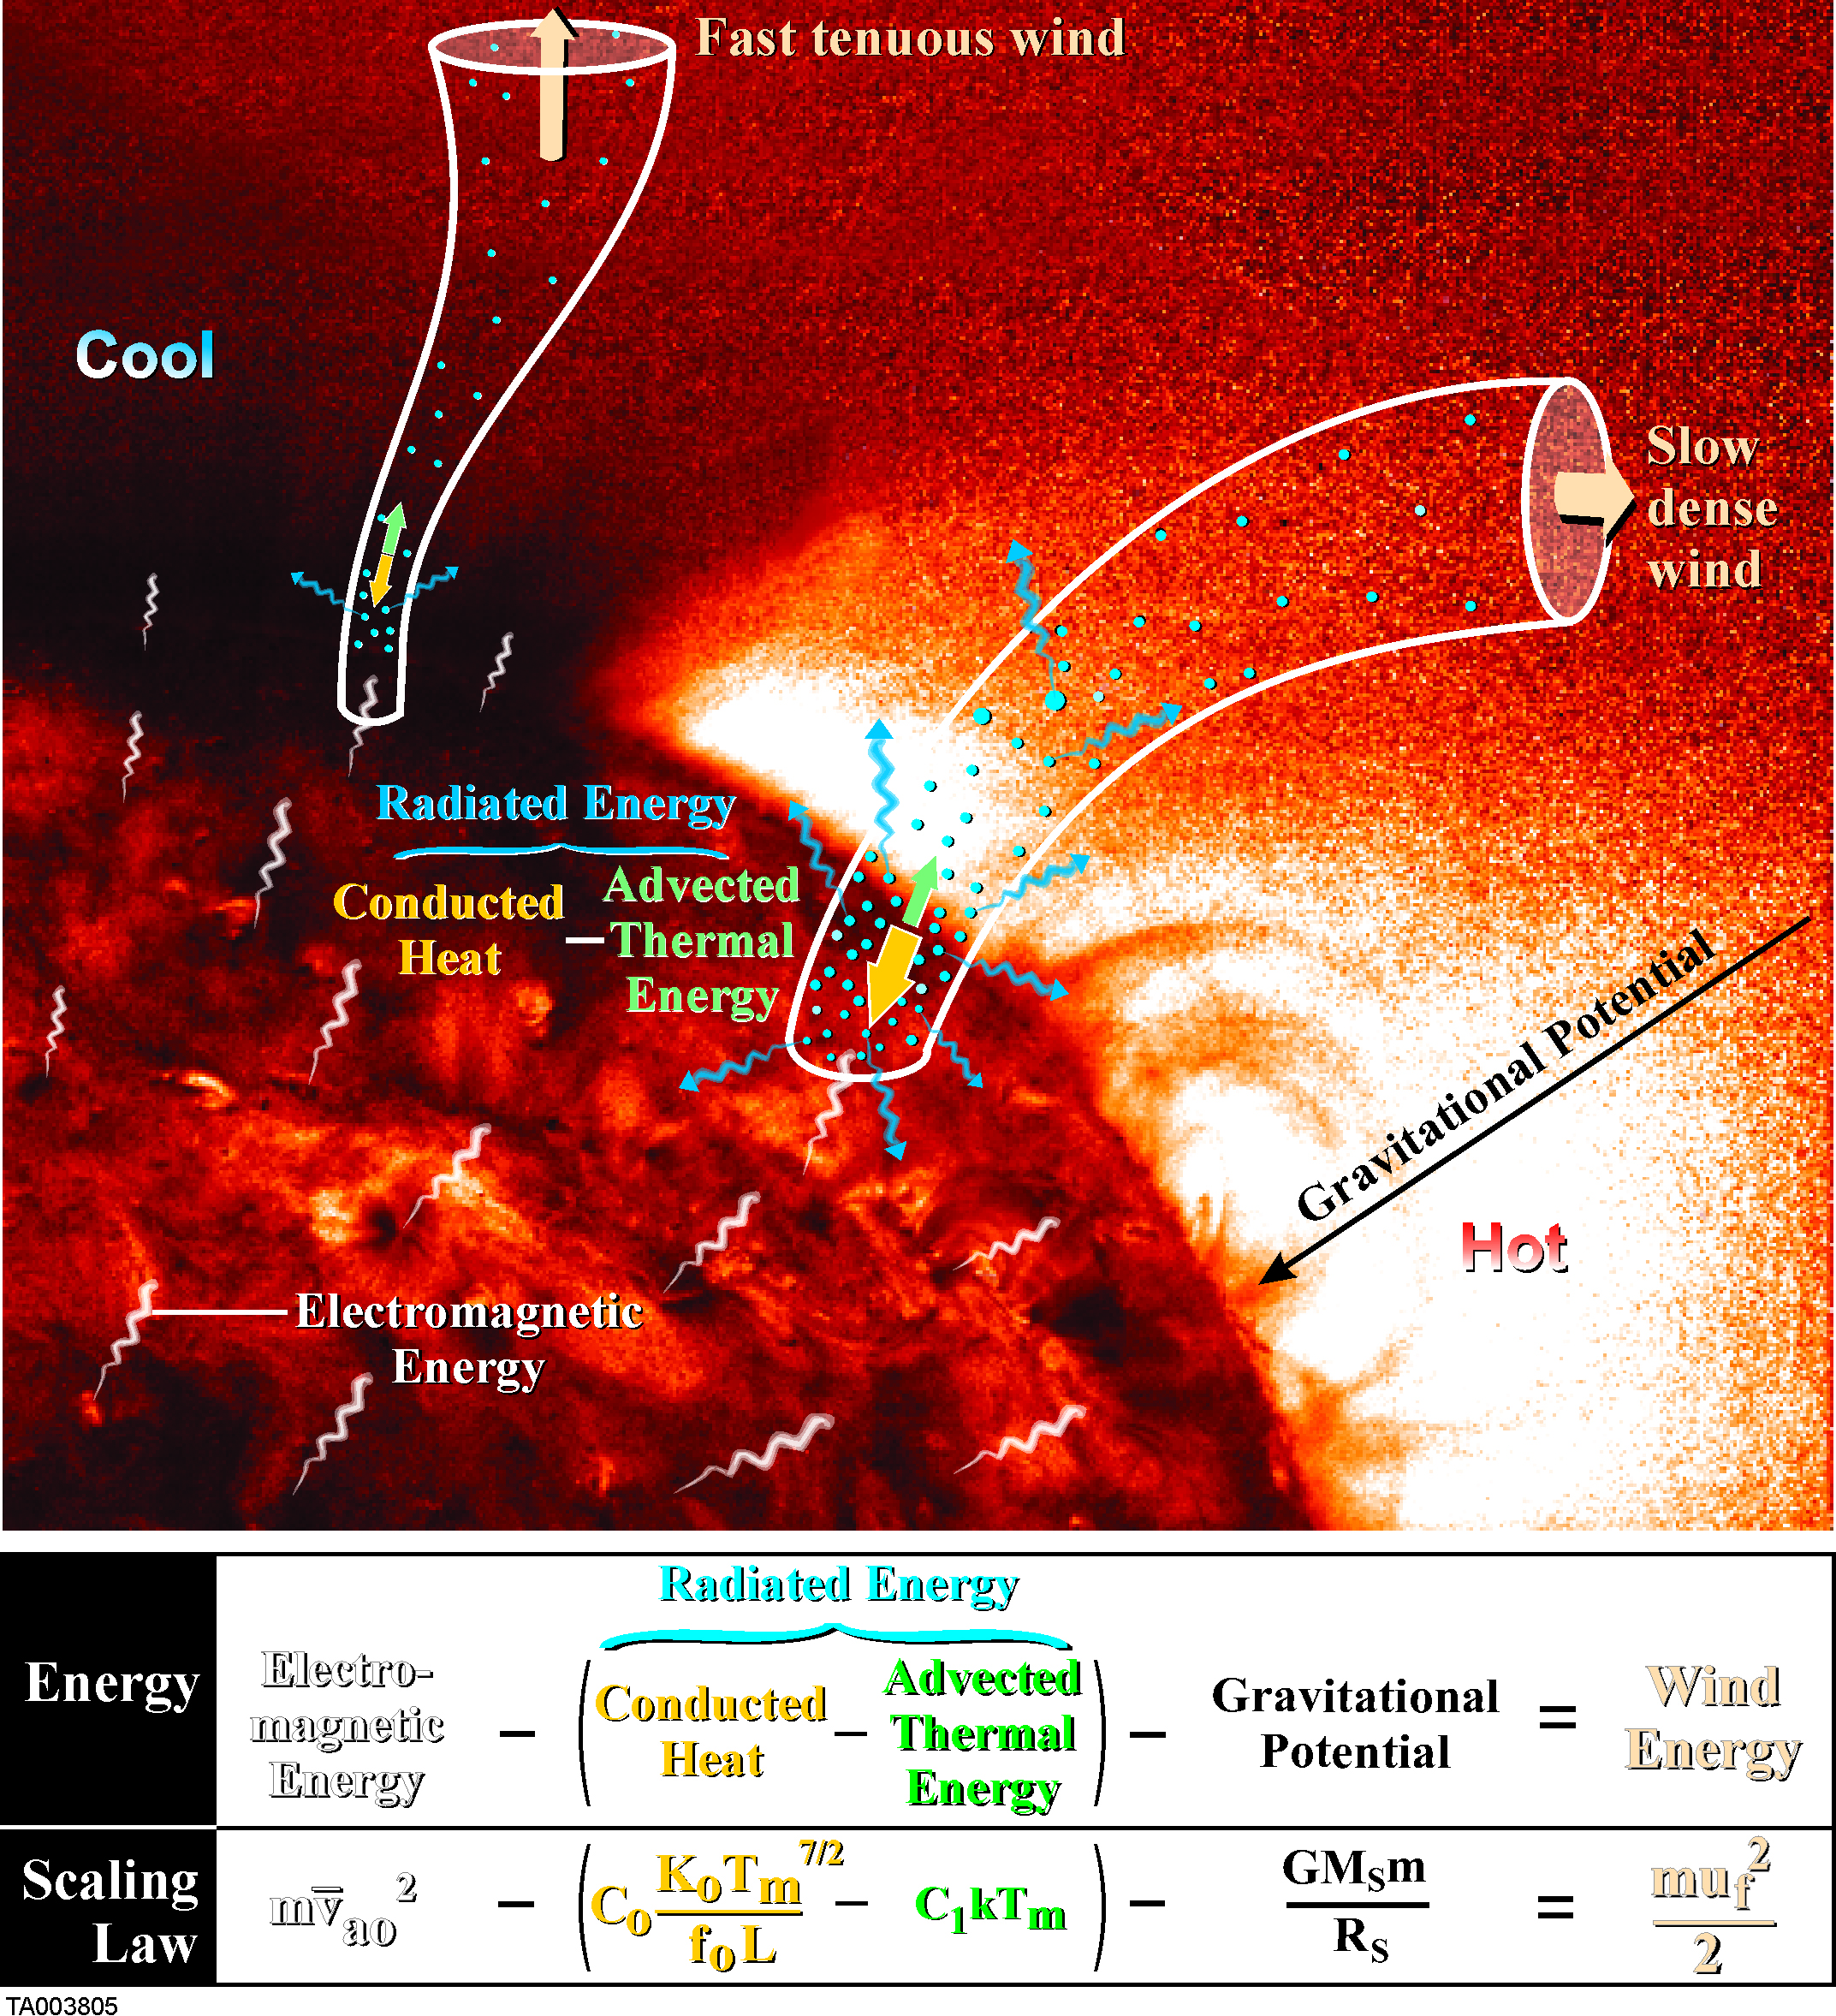
The solar wind scaling law (equations shown at bottom of graphic) links cooler coronal electron temperatures with lower solar wind particle fluxes during a solar minimum. Results of the law suggest that the evolution of the solar wind is linked to the Sun’s internal dynamo, which pro-duced a weaker coronal magnetic field during the recent deep, extended solar minimum.
The central question remains as to why the dynamic pressure remains so low through the recent solar maximum. At least part of the answer is that the coronal environment remains in a state similar to that in the previous solar minimum. In fact, the studies show that while inter-planetary magnetic field strengths have risen, they have only risen to levels that are still quite a bit lower than they were in the previous cycle. Ultimately, the mechanistic relationship between the Sun’s magnetic field and solar wind outflow implicates the Sun’s internal dynamo as the underlying energy source, and hence regulator of the solar wind. The relationship between low sunspot numbers and low solar wind power demonstrates the widespread effects of the reduction of the Sun’s open magnetic field in the mini solar maximum.
A separate study by Owens and Lockwood in 2012 examined the imbalance between open solar flux sources and losses, including geomagnetic observation inferred values back to 1868 and sunspot inferred values back to 1610. The study connected the last two solar minima with features of the Maunder Minimum, a period of unusually low sunspot activity between 1645-1715 named after its discoverer, British astronomer Edward Walter Maunder, and suggest that the recently observed large current sheet tilt despite low CME rates and sunspot numbers also may have been present in the Maunder Minimum. (A similar period, named the Dalton Minimum after English meteorologist John Dalton, lasted from about 1790 to 1830).
It remains to be seen if the most recent solar wind observations are heralding a new long-term Dalton or Maunder-like minimum. In any case, these are exceptional times, with the Sun producing its weakest output of the Space Age through both the protracted solar minimum and current mini solar cycle maximum.
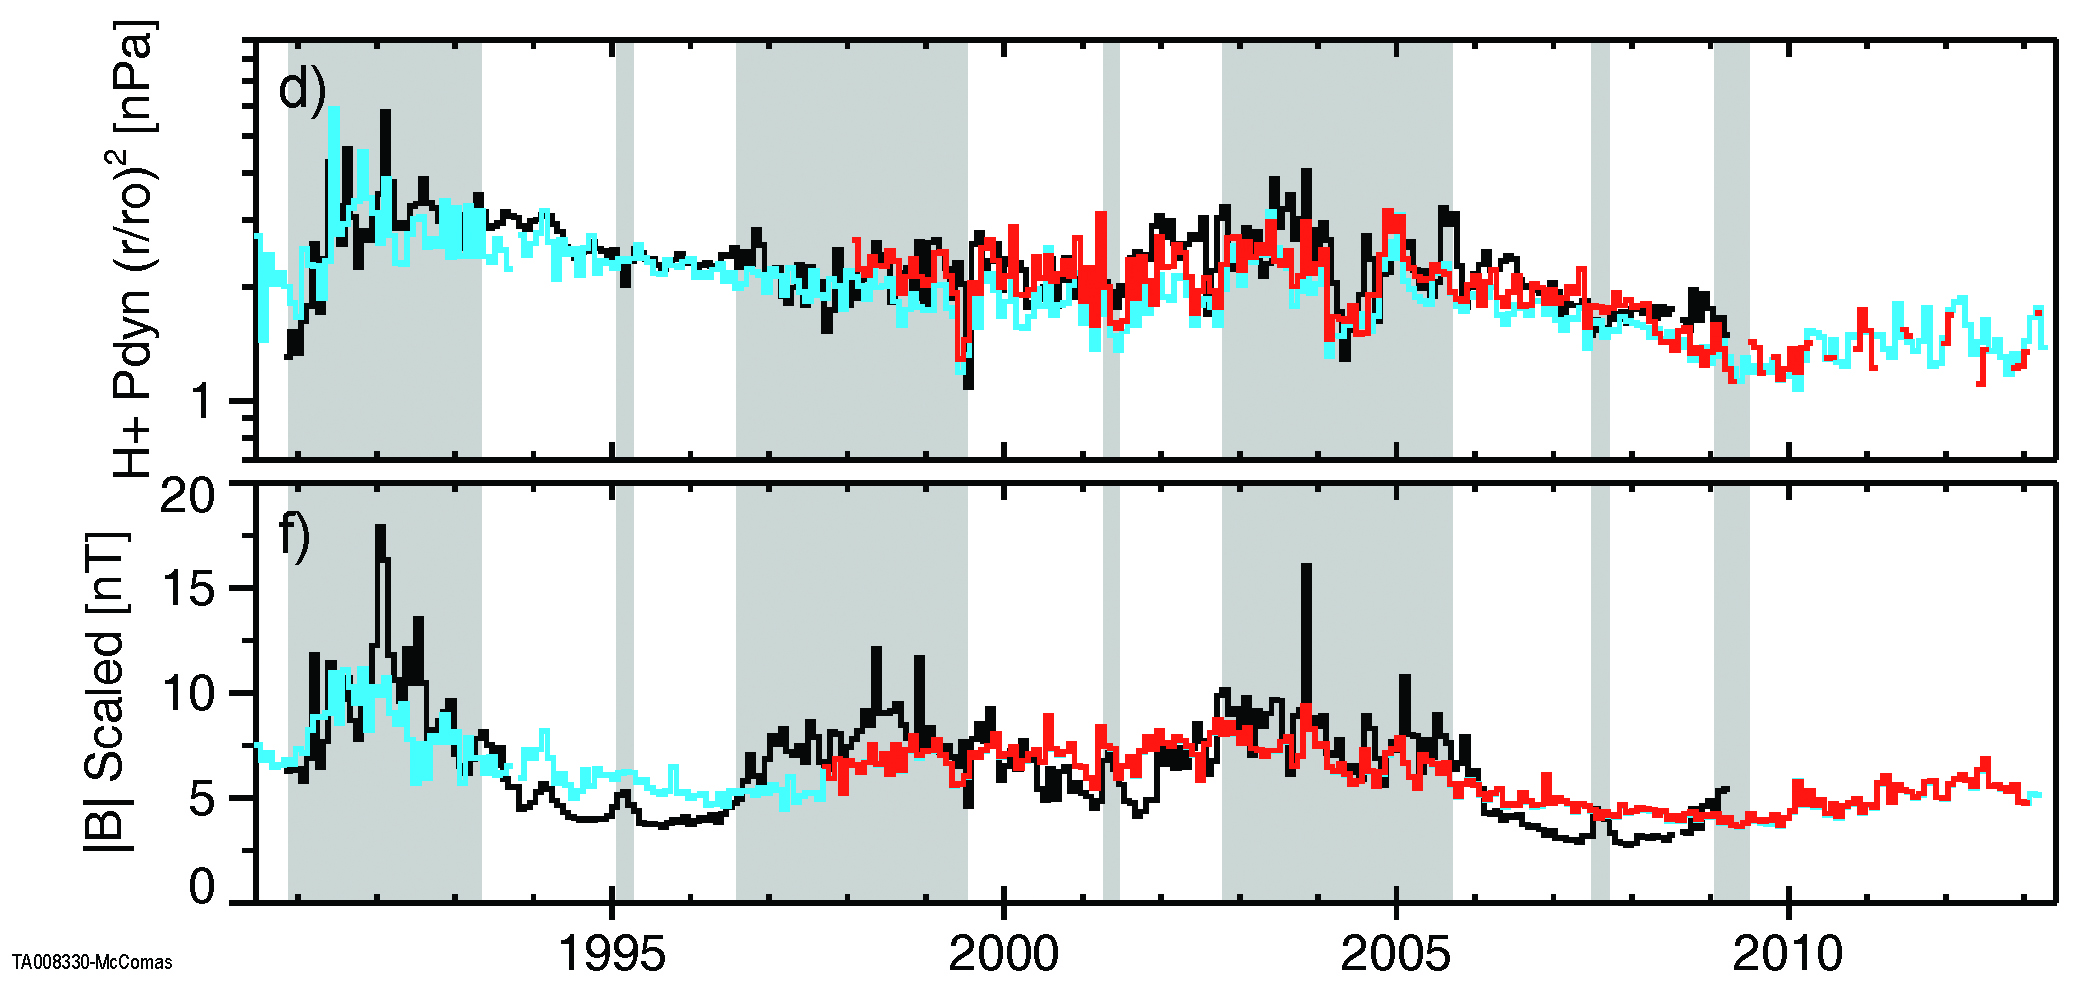
Solar wind dynamic pressure (top) and interplanetary magnetic field magnitude (bottom) over the past 25 years. Ulysses (black), ACE (red) and other spacecraft (blue) all show that both the pressure and field are significantly lower than a decade ago, and have remained lower even through the current mini solar maximum.
What happens next?
A key question for the current maximum is how the Sun recovers from the protracted, low-activity solar minimum that preceded it. The team re-analyzed data from that period to glean any information about increasing coronal temperatures from charge states as temperatures rose toward a new maximum. The key observational result is that coronal temperatures did increase toward the recent cycle maximum, but they did not recover to anything close to their highs of the previous cycles. In addition, the new study also showed that after that increase, there was a drop of coronal emperatures in the most recent data. This suggested that we may have already passed through the current solar maximum in 2013. Coronal temperatures continue to show remarkably low values indicative of the anomalous lack of solar activity in the era that began approximately in 2005. Since then sunspots have gone through a second small peak, similar in magnitude to that in 2013 and far lower than in recent previous cycles.
In other recent work, insights into the evolution of the interplanetary magnetic flux were used to determine its time history based on sunspot numbers going back to 1749. Sunspot records from the Dalton Minimum resemble those of the past 15 years, and at this point the sunspot number is comparable to what was seen during the first reduced maximum of the Dalton Minimum era. The years following 1805 therefore may serve as a predictor for the coming 10 years of solar activity. With the 10-year predictions of sunspot number, the same theory was applied to determine the levels of interplanetary magnetic flux. The conversion of magnetic flux to particle flux, and application of the solar wind scaling law to infer coronal temperature, indicates that temperatures could fall to levels even lower than were observed in the previous two solar minima.
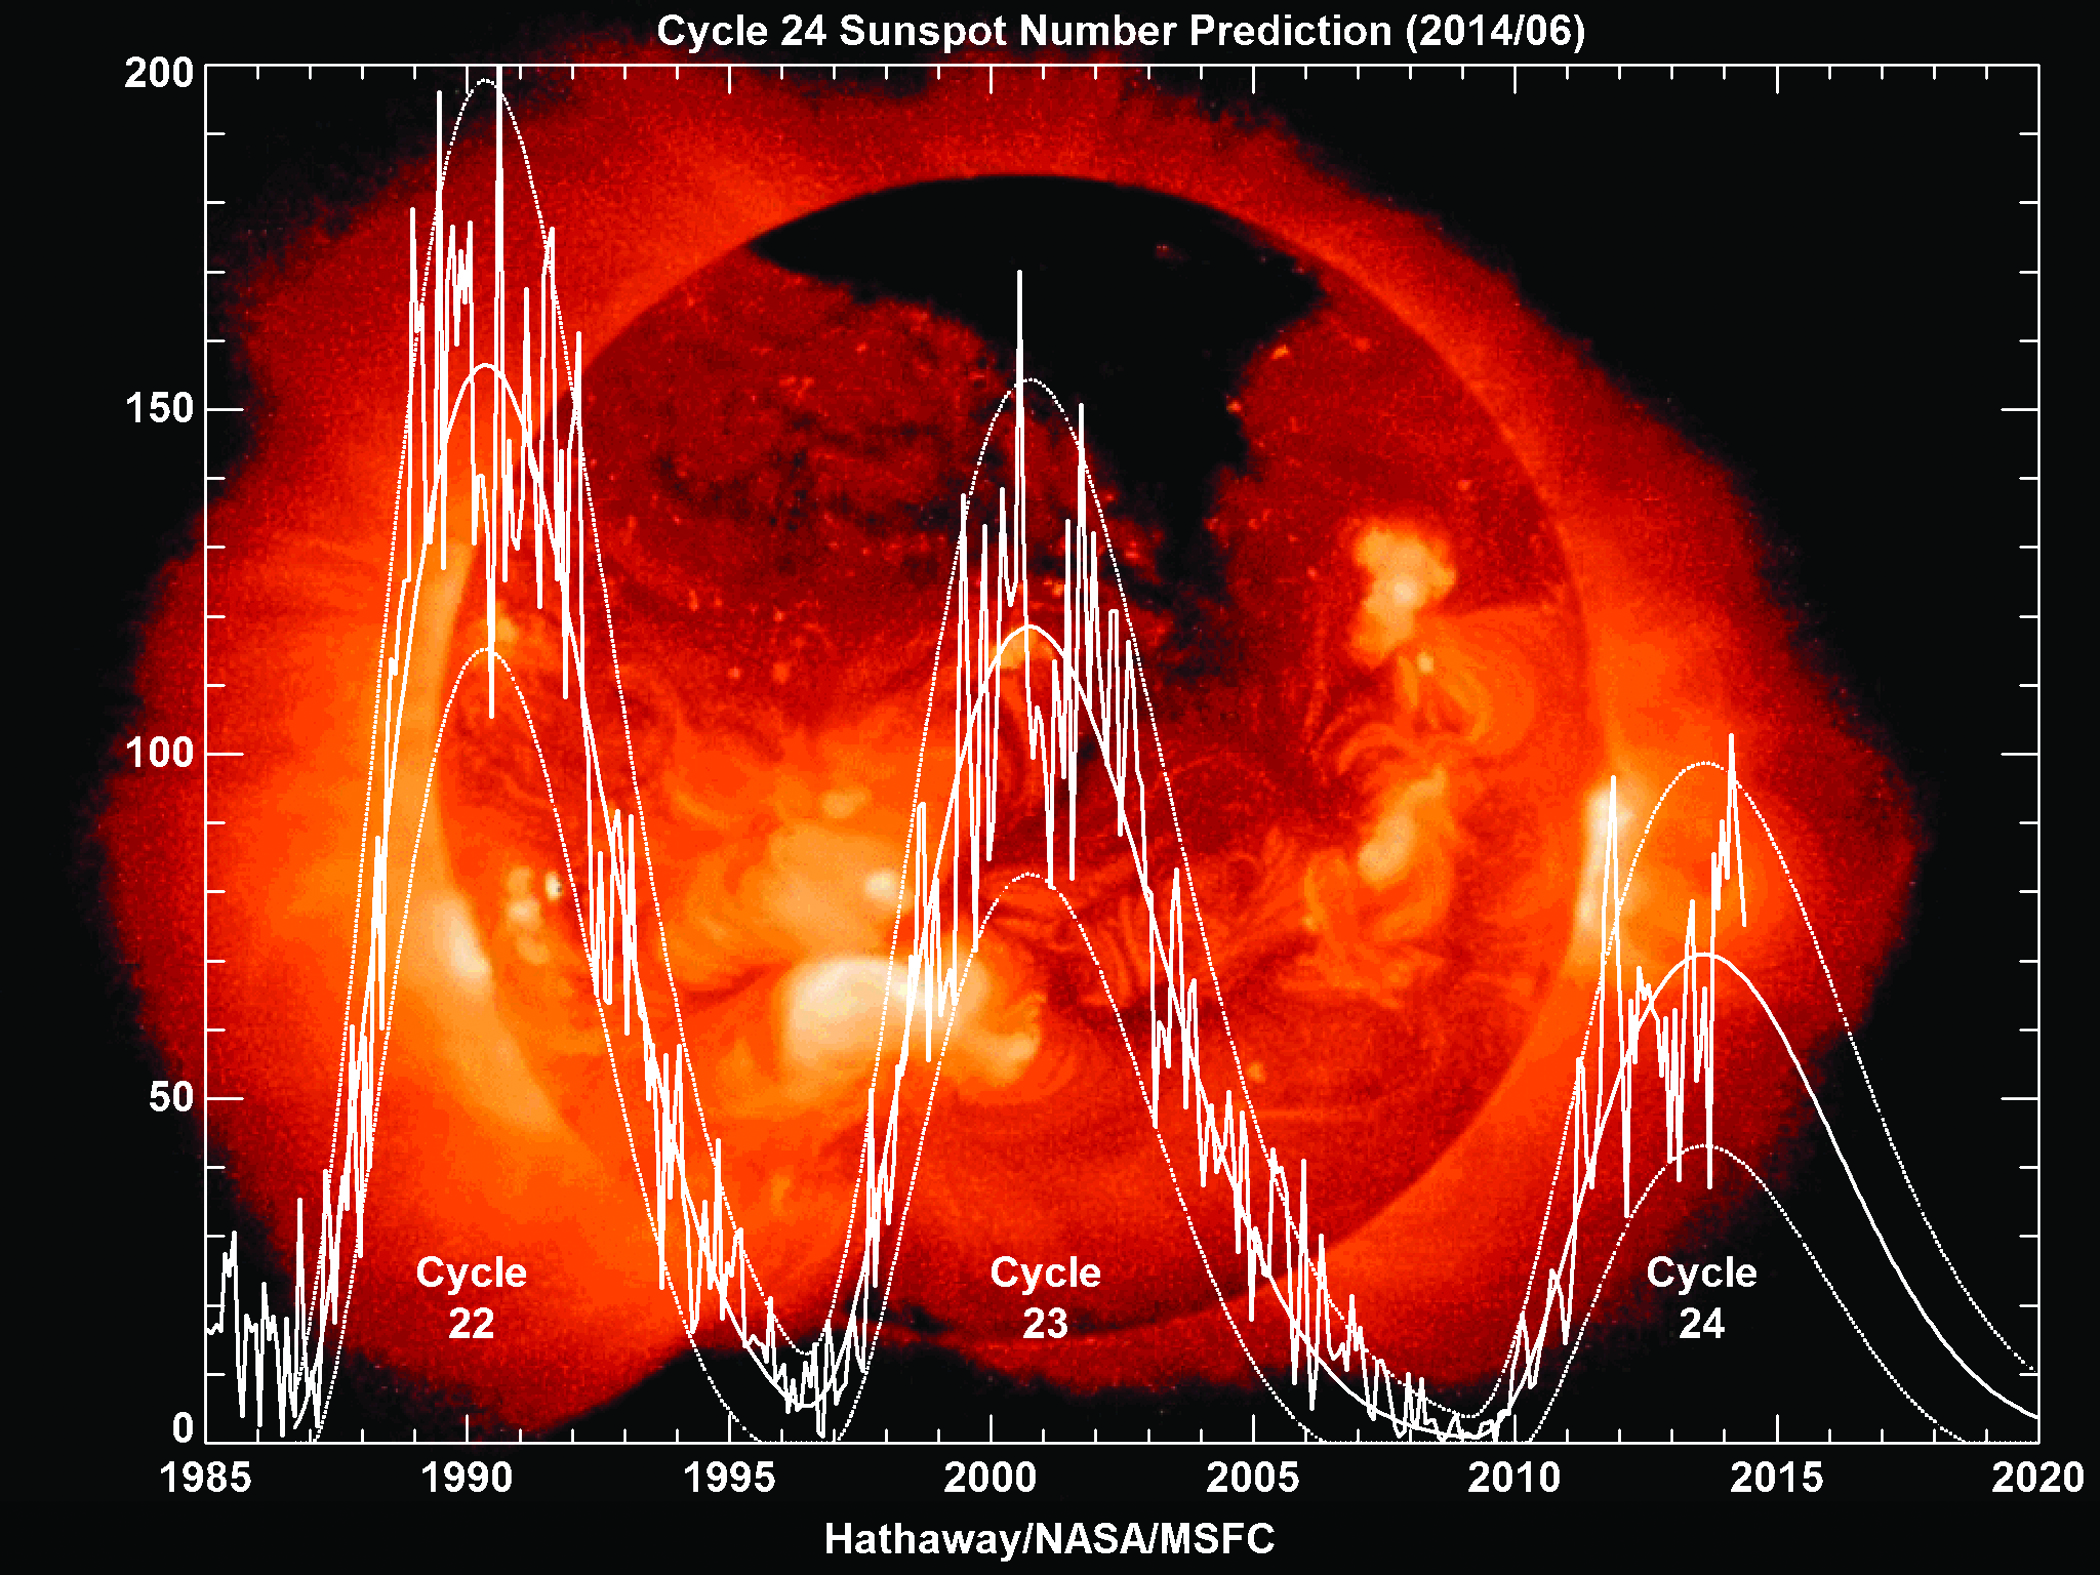
Sunspot numbers at the peaks of the last three solar cycles show a declining pattern, with a significantly weaker twin-peak maximum for the most recent cycle.
Questions about this article? Contact SwRI Solutions.
ACKNOWLEDGEMENTS
The author thanks NASA for sponsoring this work and the members of the Ulysses and ACE mission teams. The author gratefully acknowledges contributions to the research involved in this article by Dr. Heather Elliott and Dr. George Livadiotis of the SwRI Space Science and Engineering Division and Dr. Nathan Schwadron, previously of SwRI and now at the University of New Hampshire.