
Background
Elevated temperatures, especially when sustained for extended periods without relief, cause heat stress that can severely debilitate or even kill vulnerable members of the public. Heat stress is of particular concern for residents lacking resources to mitigate elevated temperatures. Lying close to the urban downtown San Antonio core, the study area of the Historic Westside of San Antonio is a low-income area subject to South Texas climatic conditions that may be exacerbated by an urban heat island effect, which occurs when the urban environment experiences systematically warmer temperatures than the surrounding countryside
The project, funded as part of the SwRI-UTSA Connect Program, combined SwRI’s environmental modeling expertise with urban planning researchers from UTSA to better quantify actual conditions experienced by residents of the Historic Westside inside and outside their residences. The long-term goal is to identify conditions that increase and mitigate heat stress, helping to guide potential future mitigation strategies throughout San Antonio and other areas experiencing heat stress.
Approach
The project featured a multipronged approach to quantifying heat stress in the study area, with UTSA researchers focusing on site-specific data acquisition and outreach and SwRI researchers focusing on computational aspects. The goal was to precisely quantify thermal conditions and identify mitigating approaches at specific well-characterized locations with representative housing.
UTSA researchers undertook extensive outreach to encourage community participation and identify appropriate locations. Ultimately, a pair of air quality sensors (temperature, relative humidity, and particulate concentration) were placed at 19 volunteer residences in the study area, one inside and one outside each residence, paired with an extensive assessment of residential conditions. Most sensors were placed in the spring of 2024.
SwRI examined approaches for calculating felt heat across the study area with an appropriate combination of ground-based sensors, readily available meteorological model output, detailed numerical modeling, and remote sensing imagery. The emplaced study sensors provide a basis for model comparisons.
The selected computational approach calculates UTCI inputs within a property or at the street scale at hourly intervals using (i) available sensor data or the national-scale Real Time Mesoscale Analysis (RTMA) weather model to characterize air properties and (ii) detailed radiation balance calculations that account for clouds, shading, and reflections using a digital twin (a three-dimensional representation of features such as buildings, individual trees, and pavement). A longer-term goal is to extrapolate UTCI patterns across neighborhoods to assess accumulated heat stress while moving around the neighborhoods.
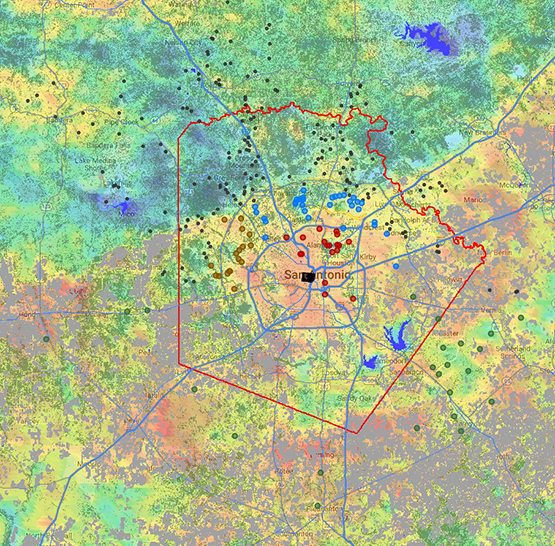
Figure 1: Average land surface temperature 6/1/2022 to 9/30/2022 as imaged by MODIS (dark red = 115 °F, dark blue = 85 °F). Dots are color-coded Weather Underground stations in Figure 2. The dark green overlay is mapped as canopy and the gray overlay is mapped as cropland. The Historic Westside study area is the black polygon.
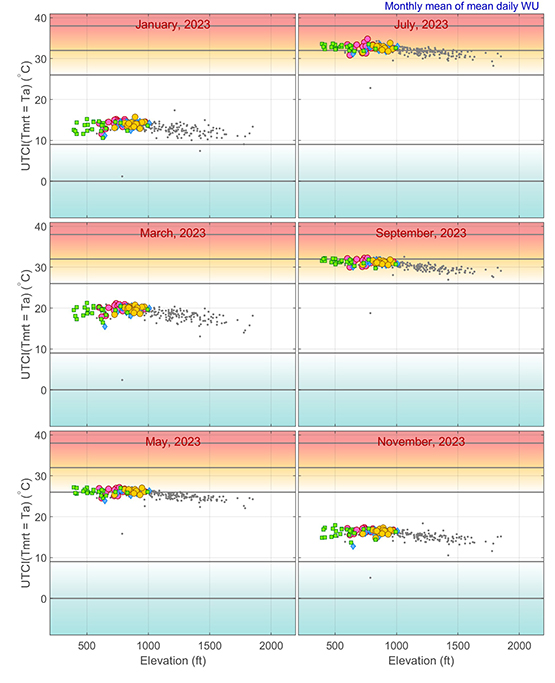
Figure 2: Monthly averaged mean daily UTCI in 2023 at selected Weather Underground stations with neutral radiation (without considering site-specific factors). Underlying warm colors indicate heat stress, underlying cool colors represent cold stress. Average daily July UTCI is in the strong heat stress category. Daily maximum UTCI is higher by one stress level with neutral radiation and two stress levels higher in direct sunlight (bordering on extreme stress across the summer).
Accomplishments
UTSA researchers (i) assigned housing stock to local climate zones in the study area based on the built environment, (ii) performed a detailed housing condition assessment for 404 dwellings with direct community input, and (iii) placed exterior and interior sensors.
Three key factors were identified for determining urban thermal comfort in the study area: (i) proximity to large streets, (ii) tree canopy cover, and (iii) housing condition. Most of the exterior sensors had consistent readings, but a few showed extremely hot peak temperatures. All interior temperatures are typically elevated (80 to 100 °F), with several houses reaching >100 °F even in June. Interior particulate air quality varied from excellent to frequently much poorer than the exterior (e.g., from poor cooking exhaust).
SwRI research focused on (i) assessing input data uncertainties and (ii) developing software tools to perform energy balance calculations. UTCI estimates assuming neutral radiation load were compared for (i) data from a 273-station subset of Weather Underground® stations typical of residential areas in Bexar County and surrounding areas (Figure 1) and (ii) RTMA outputs at the same locations. Other potential stations were culled due to extreme outliers or significant data gaps in 2023. UTCI calculated from the weather station data (Figure 2) showed an elevation-dependent trend, arguably with a superimposed small increase closer to downtown. UTCI calculated from the RTMA data is generally consistent with Figure 1, but systematic biases significantly underestimate UTCI near downtown (not shown). Tools developed in the project consider shortwave and longwave radiation emittance and transmission within a simple digital twin of a twelve-block section of the Historic Westside, a precursor to performing energy balance calculations.