BACKGROUND
Managing water resources in arid and semi-arid dryland landscapes is increasingly important because of pressures from escalating water demand, limited water availability and uncertainty resulting from global climate change. Groundwater is an important component of available water resources, and appropriate resource management requires that replenishment through recharge be accurately determined. In drylands, the available soil moisture storage in upland areas, with steep slopes and thin soils, is a critical factor that strongly influences when and how much water runs off and becomes available for focused recharge in adjacent channels and streambeds. The available soil moisture storage depends on both soil depth (total capacity) and currently stored moisture content (fraction of capacity utilized). Importantly, soil depth can vary widely with position across a landscape.
Satellite-based radar data is capable of partially filling this gap because (i) satellite sensors can view entire watersheds and (ii) radar is sensitive to soil moisture and penetrates the soil up to 5 cm deep (depending on wavelength). The National Aeronautics and Space Administration (NASA) provides gridded soil moisture products at 3 to 36 km resolution, derived from L band radar from the Soil Moisture Active Passive (SMAP) satellite and auxiliary data. However, these gridded products are measured at a spatial scale that is much coarser than needed to resolve hydrologically significant soil moisture patterns in upland areas.
Given the critical importance and difficulty in accurately calculating dryland recharge, the project was intended to develop and assess techniques that use newly available satellite sensed data to improve recharge estimates by reducing uncertainty in soil moisture at spatial scales relevant to regional water balance models. The research focused on upland areas that are critical to dryland recharge where there are technical challenges and uncertainties associated with sensing moisture changes in rugged topography that have remained unstudied.
APPROACH
The project defined two separate but related tasks: (i) analysis of the data gathered by satellite based sensors, especially on upland topography to better understand the limitations and opportunities offered by the data and (ii) development of methodologies that use the satellite sensed data to constrain recharge calculations. The first task was intended to improve interpretation of the data (especially in arid and semiarid North America) and identify potential improvements to future Earth-observing satellite missions. The second task was intended to advance understanding and effective management of critical groundwater resources, focusing more specifically on west Texas, using the satellite data.
Several candidate satellite based data sources were assessed for further study, including SMAP, Soil Moisture Ocean Salinity (SMOS), Cyclone Global Navigation Satellite System (CYGNSS), Geostationary Operational Environmental Satellite (GOES), and Sentinel 1. SMAP and SMOS are passive sensors that detect L band emissions from the land surface, with similar >10 km resolution and quasi-daily observation frequency, but obtained using different observation strategies. CYGNSS senses L band radar signals that are emitted from Global Positioning System (GPS) satellites and reflected from the land surface, again with >10 km resolution and quasi-daily observation frequency between latitudes 35° S and 35° N. GOES provides hourly observations in the visible through infrared spectrum, with a native resolution of 0.5 to 2 km. Sentinel 1 emits polarized C-band radar and receives polarized backscatter at a 10-m grid resolution, with a 12-day repeat frequency. Sentinel 1 data is being incorporated into SMAP products as a replacement for the failed active L band component in the SMAP satellite.
Disaggregation of the coarse spatial resolution of the SMAP, SMOS, CYGNSS and GOES data products into hydrologically significant units requires auxiliary fine-scale information to describe the land surface, while the Sentinel 1 data products have a native resolution that is fine enough to directly represent hydrologically significant units. Importantly, satellite- based data products are extremely large, especially for datasets of images acquired over years and for products with fine resolution. Efficient manipulation of these very large data streams is an important practical consideration.
The project chose to focus on analyses using the Google Earth Engine (GEE) (see https://earthengine.google.com/) to (i) minimize data acquisition and manipulation overhead and (ii) facilitate intercomparisons with relevant hydrologic information. GEE includes (i) a large and growing database of more than 400 publicly available georeferenced datasets, including Sentinel 1 backscatter data and optical/infrared images derived from the Landsat (30 m resolution), MODIS (250 to 1000 m resolution) and Sentinel 2 (10 to 40 m resolution) platforms; (ii) a powerful Application Programming Interface permitting exploratory analyses, including visualization using the Google Maps platform; and (iii) a server farm that performs image processing in parallel. The GEE database includes raster data collections, in the general categories of (i) satellite based imagery, (ii) geophysical data (e.g., terrain, land cover and surface temperature), (iii) climate and weather (e.g., atmospheric data, weather datasets, and climate model predictions), and (iv) demographic data, as well as various vector data collections, such as political boundaries and roads. The imaging interface overlays the images onto the Google Maps background at the full range of available scales, allowing images from different collections or observation times to be directly compared, merged and manipulated. The GEE platform automatically partitions analysis tasks onto multiple servers in parallel by tiling the images, and provides a variety of methods for filtering and reducing the data collections and performing geospatial analysis. The GEE platform provides strong capabilities for creating land surface classifications using single or multiple data streams.
The GEE platform has the significant advantage that no data product in the GEE database needs to be acquired, stored and georectified prior to analysis. CYGNSS and GOES products are not included in the GEE database and only highly processed data derivatives of SMAP and SMOS are included. These products are not excluded from the GEE package because georeferenced image pixels can be extracted from these products using external processing and then uploaded to the GEE platform. For simplicity, the project took advantage of the capabilities of the GEE platform by focusing on analyses with the high-resolution Sentinel 1 dataset already available. Processing and analyzing the high-resolution data provides insights into approaches suitable for processing the other candidate datasets.
ACCOMPLISHMENTS
The project team assessed four radar based satellite datasets (SMAP, CYGNSS, SMOS and Sentinel 1) early in the project, and one hourly optical/infrared satellite dataset (GOES), and assessed alternative platforms for performing analyses. The project team selected the GEE platform as providing a powerful combination of analysis tools and available datasets for gaining hydrological insight using satellite-based remote sensing, and selected the Sentinel 1 dataset (available with the GEE platform) as the primary dataset for analysis.
Sentinel 1 image processing. The team focused on the Sentinel 1 radar backscatter data in the Interferometric Wide Swath mode, the most common format. This backscatter is available in vertical-vertical (VV) and vertical-horizontal (VH) polarizations. The Sentinel 1 raw radar reflectance is strongly correlated to the sensor look angle (i.e., azimuth and elevation) relative to the hillslope slope and aspect, with much stronger reflectance when the hillslope is facing the sensor, and each image includes substantial speckle that is much larger than the average backscatter response to changing moisture state. The team developed processing protocols for despeckling a time series of images, using a detailed digital elevation model to account for land surface orientation and a base map developed from a series of observations, preserving distinct topographic and land surface features with reduced blurring.
Hydrologic response units. The project developed improved approaches for evaluating hydrologic response units (HRUs) using processed Sentinel 1 images. Watershed and groundwater models, critical for managing water resources in drylands, are typically developed by partitioning the land surface into HRUs that locally mediate between infiltration and runoff. Within each HRU, the hydrologic properties are similar. The mean and standard deviation of backscatter calculated from a time series of Sentinel 1 images are strongly correlated to the land surface properties, land use management practices, and, in hilly terrain, the geologic unit. HRUs can be developed directly from backscatter properties, or by combining the backscatter properties with other land surface information. For example, GEE backscatter data can be combined with standard indices developed from optical/infrared images, such as the Normalized Difference Vegetation Index (NDVI), or with standardized datasets such as the USGS National Land Cover Database. HRUs could also be developed specifically for monitoring hydrologic behavior in a small fraction of the landscape, such as river channels and riparian zones, greatly reducing processing.
Precipitation mapping. Several complementary indexes based on change in Sentinel 1 backscatter were developed to identify and confirm precipitation tracks, important because recharge estimates require accurate precipitation inputs. Although a variety of gridded precipitation products derived from surface- and satellite-based remote sensing are widely available at time scales from hours to days, these products tend to be less accurate in areas where ground measurements are widely scattered. Indexes based on the difference between VH and VV backscatter were found to provide the strongest indication of precipitation tracks and can provide a high-resolution image of both precipitation tracks and downstream flooding. Different indexes using the same data are preferable, depending on whether the goal is to identify (i) the actual footprint of the storm or (ii) the areas with largest changes in soil moisture.
Visualization approaches. The project team developed several tools to reduce and combine information for visualization analyses, important due to the tremendous amount of information contained in multiyear sequences of high-resolution images. One tool allows interactive comparison of multiple side-by-side maps combining different source images and image transformations, selecting particular times or scrolling through consecutive images; the tool potentially includes any of the databases in the GEE platform. Another tool creates site-specific animations based on various maps of transformed backscatter and optical data, combined with site-specific traces in time for precipitation, temperature, and soil moisture data (see Figure 1). The same data can be displayed using multiple traces in time for a point or averaged over selected areas with yet another tool.
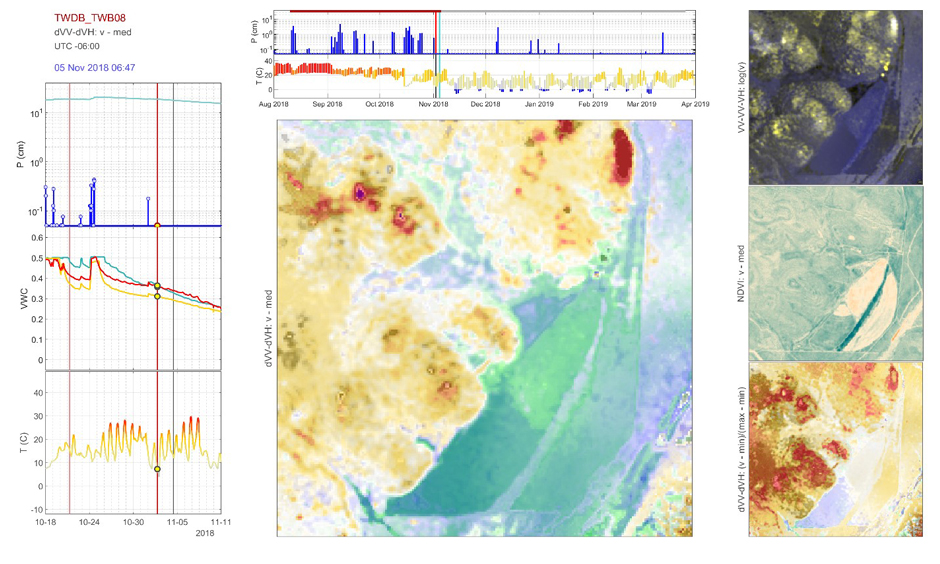
Figure 1: Snapshot from an animation of a 2-km-square area of the upper Devils River watershed, Val Verde County, TX, for November 5, 2018. The left column displays precipitation, soil moisture and air temperature from an on-site station for a short window of time near the image acquisitions. The center top plots show the daily precipitation and temperature at the site over the animation period, using gridded data. The large central plot uses an index based on the difference between VV and VH backscatter. The plot shows the difference in the index value from the median over the year, with blues and greens representing wetter conditions than the annual median and browns and grays representing conditions drier than the annual median. The right column shows, from top to bottom (i) the log-transformed VV and VH backscatter as an RGB image, (ii) the NDVI over the area and (iii) a normalized version of the same index shown in the center plot. The NDVI plot is dark green where vegetation is densest; the orange band in the lower right corner is due to flooding in the Devils River. The normalized index enhances sensitivity in areas of shallow soil, important for mapping precipitation events.
Terrain correction testing. The team devised testing protocols to confirm terrain correction formulations based on comparing Sentinel 1 acquisitions for the same location at different times and different look angles. Terrain correction is vital when compositing images obtained from different angles. Backscatter depends on surface properties, but backscatter also can be quite dependent on the look angle onto the terrain relative to the local surface slope. Sentinel 1 acquisitions consist of 250-km-wide descending and ascending tracks, acquired at approximately 6 a.m. or 6 p.m. local time, respectively. The Sentinel 1 look angle changes by 15 degrees across the track width. Track edges overlap with the adjacent tracks to the east and west, providing zones with two different look angles onto the same terrain. Some areas also overlap ascending and descending tracks, again providing two different look angles onto the same terrain. Three or four tracks overlap on a small fraction of the Earth’s surface, with look angles that differ up to 70 degrees; these areas are especially useful for testing terrain correction algorithms.
Ecohydrologic inferences. The project team observed distinct seasonal patterns in Sentinel-1 data based on landscape position, overlaid with episodic responses due to soil moisture increases from rainfall events, ground freezing, snow and surface roughness changes (e.g., agricultural plowing). Based on the Sentinel-1 data, the team infers that there is a somewhat different seasonal pattern in above-ground vegetation moisture for native vegetation in central Texas, depending on landscape position. Surprisingly, vegetation in upland areas of the Hill Country, with minimal soil cover over limestone, appears to retain moisture longer into the summer than in lowland areas, even though the deeper soils in lowland areas presumably have greater soil moisture reserves.
Geomorphological inferences. The team performed extensive testing with the developed remote sensing toolboxes, focusing on terrains with banded vegetation, to develop inferences regarding coupled interactions between climate, sediment and vegetation. In certain dryland landscapes, such as west Texas, denser patches of vegetation may occur elongated along contour (vegetation bands, sometimes called tiger stripes) separated by zones with minimal vegetation. Such patterns develop on flatlands, when short range sheet runoff can locally support denser vegetation but the available moisture is not sufficient to maintain a closed cover. Such landscapes are useful for understanding the differences in backscatter between bare soil and vegetation. Candidate locations favoring banded vegetation can be readily identified in a landscape from backscatter and slope, augmented by NDVI. Locations with banded vegetation almost always have low backscatter (indicating significant soil cover) and very small surface slope. The range of locations across North America, Africa, Asia and Australia, many in buried stream and river channels, strongly suggest that vegetation plays a significant role in slowing sediment fluxes through the landscape in dryland environments, promoting geomorphic evolution by channel and valley infill. Bands have been observed to move upslope over time, because new growth is generally favored on the wetter side of the patch. It can be inferred that, even though vegetation bands efficiently trap sediment, sediment can still progress through the system because of loss of vegetation on the downslope side releases the trapped sediment.
Agricultural inferences. The team examined potential application areas related to agriculture for further exploration. Crop status is often measured with indices such as NDVI, but sometimes it is difficult to reliably obtain NDVI measurements because of cloud cover. Measured Sentinel 1 backscatter changes with the above-ground moisture in crops, which depends on plant growth and vigor, and empirical crop-specific relationships between backscatter and NDVI have been determined for several crops. Measured changes in backscatter may provide clues regarding plant status, which may provide information for inferring past irrigation and future irrigation needs during a growing season.