Background
Drylands will be disproportionally impacted in future climates. Covering more than 40% of the Earth’s surface, these natural habitats range from rangelands/grasslands to semi-desert or even forests. Despite their provision of crucial services, little is known about the response of the water dynamics of these socioeconomically important ecosystems to deviations from the average hydrologic conditions. The high level of complexity in the water dynamics of drylands is further exacerbated by the intensification of the hydrological cycle. Dryland ecosystems’ highly vulnerable nature to climatic variability, combined with the increasing frequency of extreme hydrologic conditions globally, emphasizes the need to conceptually understand their behavior and quantify their ecological disturbances during extreme hydrologic events. Assessing the hydrologic vulnerability of drylands in the context of climate change will provide information that is the backbone of the long-term sustainable management of water resources in arid or semi-arid regions. To this aim, a plethora of satellite-based Earth observations, are used to assess the unique spatiotemporal water dynamics in the drylands of west Texas under drought conditions, and to develop a climate change indicator based on an emerging eco-hydrological property of these ecosystems, their hydrologic asynchrony.

Figure 1: Digital Elevation Model for the state of Texas provided by the NASA Shuttle Radar Topographic Mission (SRTM) at a 1-km spatial resolution (left). Map of Köppen climate classification types of Texas (middle). Map of major land-cover categories in the state of Texas, as defined by MODIS (right).
Approach
Hydrologic and vegetation-related observations derived from several NASA satellite missions, the Naval Research Laboratory’s WindSat, the SwRI/University of Michigan Cyclone Global Navigation Satellite System (CYGNSS), as well as data derived from a model-data fusion framework, named VIC4L-GRACE, that the Project P.I. has developed, are used to 1) investigate the hydrologic properties of dryland ecosystems, 2) identify dry spells, 3) quantify eco-hydrological vulnerability, as a function of resilience and sensitivity, 4) quantify the hydrologic asynchrony (time lag) among the major hydrologic components, and 5) evaluate the performance of the proposed climate change indicator across a regional gradient of aridity.

Figure 2: Identifying dry spells (a), investigating the hydrologic properties (b-d), and assessing the eco-hydrological vulnerability as a function of sensitivity (e) and resilience (f).
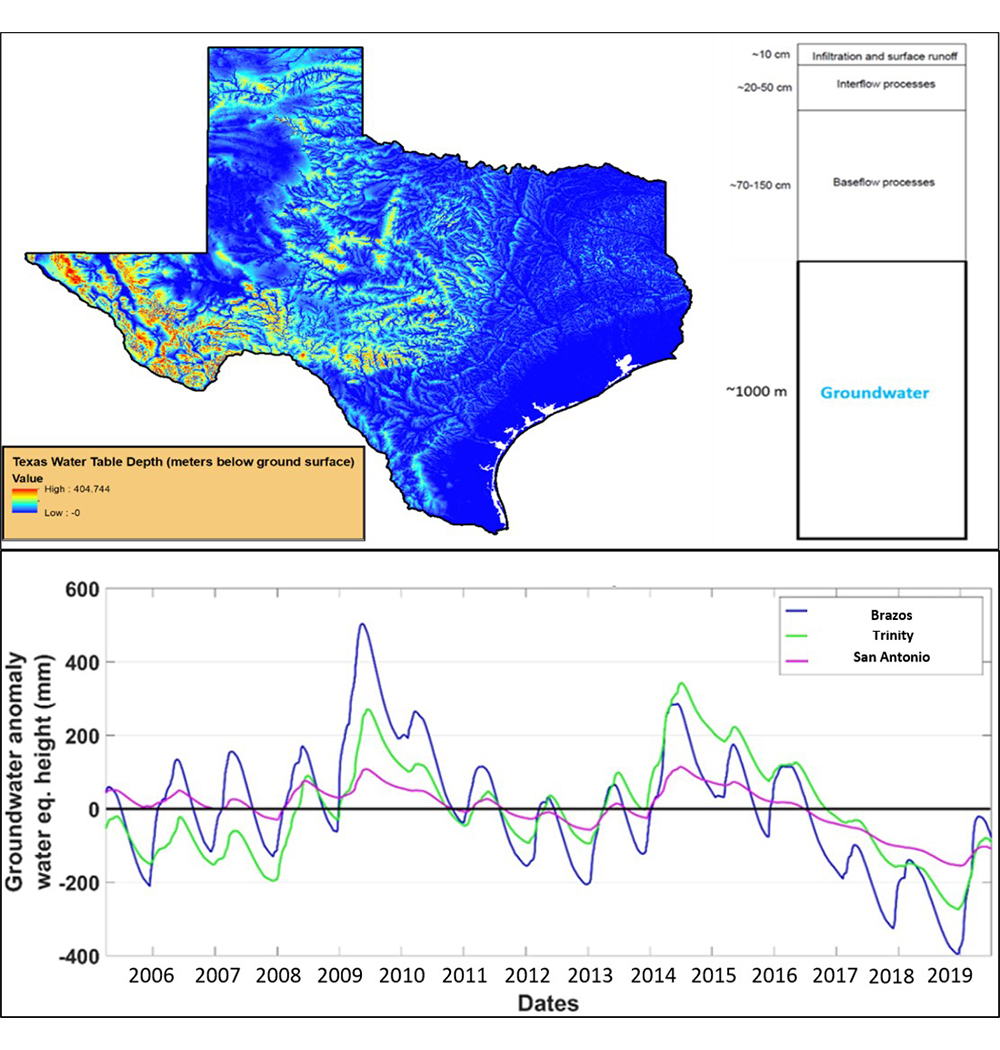
Figure 3: Gridded (~1km) water table depth data derived from observations at two million well sites and groundwater model simulations used to initialize a water table in the Variable Infiltration Capacity (VIC) hydrology model, by adding a fourth deep layer (top left). A schematic of the updated subsurface structural representation of VIC4L-GRACE that allows for the integration of GRACE data (top right). Daily times series of groundwater anomaly space-averaged over three major hydrologic basins of Texas, simulated by VIC4L in open-loop mode (bottom).
Accomplishments
Linkages and interactions among groundwater, soil moisture, vegetation water content, evapotranspiration and precipitation are assessed, while interdependencies and significant feedbacks among the aforementioned hydrologic components have also been identified. The behavior and response of these climatologically vulnerable habitats are assessed under extreme hydrologic conditions, by quantifying their eco-hydrological disturbances caused by dry-spell conditions. Finally, the hydrologic asynchrony among the major hydrologic components of these ecosystems is developed and will be used as an indicator of climate change in drylands.
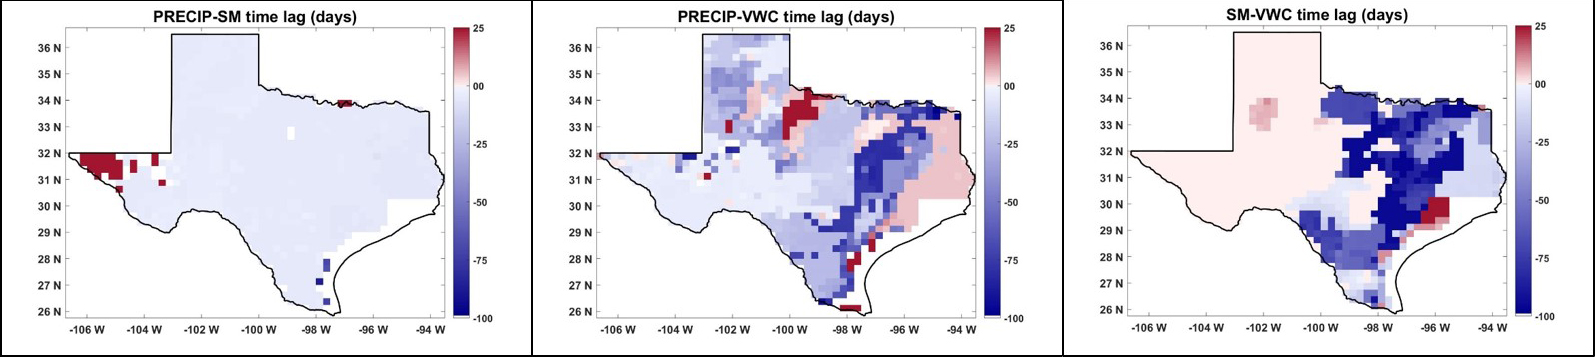
Figure 4: For each pixel, the delay in time (hydrologic asynchrony) between two time series was quantitatively assessed by calculating the cross-correlation function (ccf) and the time lag (shift of one hydrologic attribute relative to the other, in the time domain) at which ccf becomes maximum (achieving the highest Pearson Product Moment Correlation). For each pair of investigated variables, positive lag times indicate that the second (first) variable leads (lags) the first (second) one.