Background
Electric vehicles have been increasing in popularity in recent years. The drive units (motor, gear reduction, differential, and power electronics) within these electric vehicles typically use a petroleum-based fluid to lubricate the gear train and cool the electric motor and/or power electronics. There is a high likelihood that the fluid may encounter high-voltage components; therefore, the fluid must have a high dielectric constant. The industry has predominately used off-the-shelf automatic transmission fluid (ATF) to date; however, those fluids were optimized for transmission applications, and it is perceived that they could be further optimized for use in electric vehicles.
Approach
The objective of this project was to develop a method to accurately and repeatably measure an electric drive unit’s electrical power consumption and mechanical power output to calculate overall drive unit efficiency while on a test stand so that it can be used to evaluate different drive unit fluids. The 150 kW Chevrolet Bolt drive unit was used as the device under test. The original equipment manufacturers (OEM’s) inverter was used to power the Bolt drive unit; however, the inverter was modified to include a SwRI circuit board and digital signal processor (DSP) to allow for SwRI to take direct control of the inverter’s insulated-gate bipolar transistors (IGBTs). The OEM inverter control strategy was replicated with SwRI software to control the inverter and power the drive unit. This allowed for a near stock-like operation of the Bolt drive unit without requiring OEM support.
Accomplishments
The results from the testing were analyzed to determine the within-set, set-to-set and total variation produced by the developed test procedure. The target was to be able to detect an efficiency difference of ≤ 0.5% with 95% confidence. There were a few points that had too much variation to achieve this target. These points were at relatively low power where the signal-to-noise ratio of the instrumentation is at its least optimal conditions. Any point operating at greater than ± 20 kW was able to achieve, and, in many cases, significantly surpass the target as shown in the figure below.
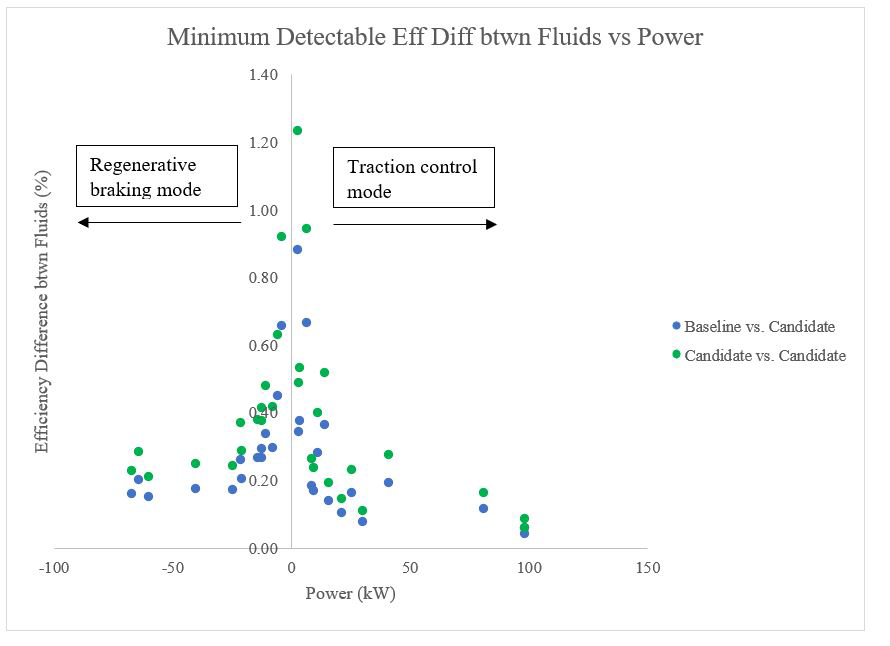
Figure 1. This figure shows the minimum efficiency difference that the test procedure could detect when comparing baseline fluid vs. candidate and candidate vs. candidate.