
Background
As the automotive industry moves towards electrification and decarbonization, fuel cell technology is emerging as a viable alternative in certain areas. Fuel cells are much more energy-dense than current state-of-the-art battery technology, making them an ideal choice for applications that require continuous high-power demanding duty cycles with brief periods of downtime. In addition, fuel cells offer a significant advantage over battery electric vehicles (BEVs), as they have similar refueling times to gasoline and diesel vehicles. These factors make them an ideal zero-tailpipe-emissions choice for Heavy-Duty (HD) and Medium-Duty (MD) applications.
The 2021 Toyota Mirai is a state-of-the-art fuel cell-powered vehicle on the market. Benchmarking the 2021 Mirai provided SwRI with valuable data and experience that will propel SwRI into a viable player in fuel cell R&D. The project's goal is to determine and develop best practices for (a) benchmarking fuel cell vehicles with on-road and chassis dynamometer testing, (b) evaluating the influence of thermal management and fuel cell balance of plant, and (c) gaining insight into Toyota's control methodology surrounding their "Transpiration" stack humidification process. This project will help pave the path for SwRI to become an advisable source for fuel cell research and supplier of fuel cell testing services.
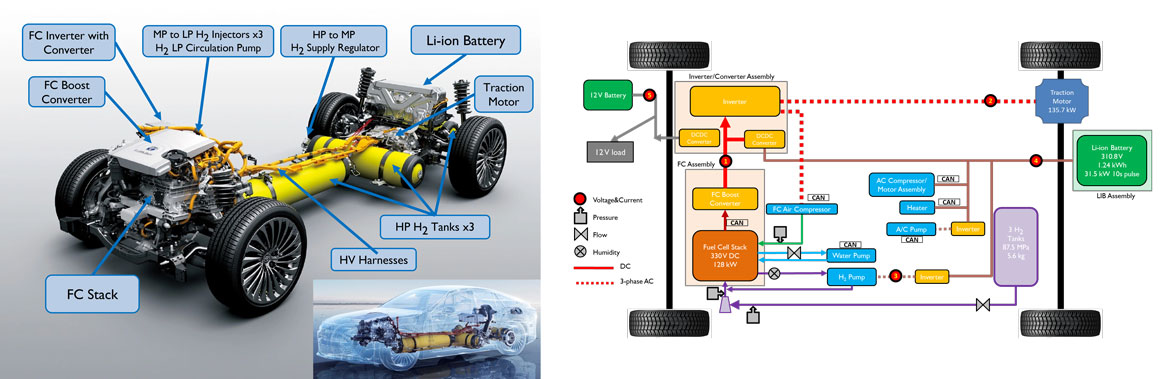
Figure 1: Top: 2021 Toyota Mirai key components. Bottom: Power structure and instrumentation
Approach
The power flow and distribution of the powertrain of a 2021 Toyota Mirai were measured through instrumentation. On-road tests were conducted at the SwRI test track and on surface roads to evaluate the fuel cell control strategies at different acceleration rates, cruise speeds, and lithium-ion battery State-of-Charge (SoC) levels. Dyno-tests were conducted in compliance with SAE J2572 to evaluate the vehicle's fuel economy. Thermal testing was performed by subjecting the vehicle to cold and hot environments, followed by immediate performance and temperature stabilization tests. The impact of cold and hot starts on the fuel cell's health and the effect of temperature on performance are being analyzed.
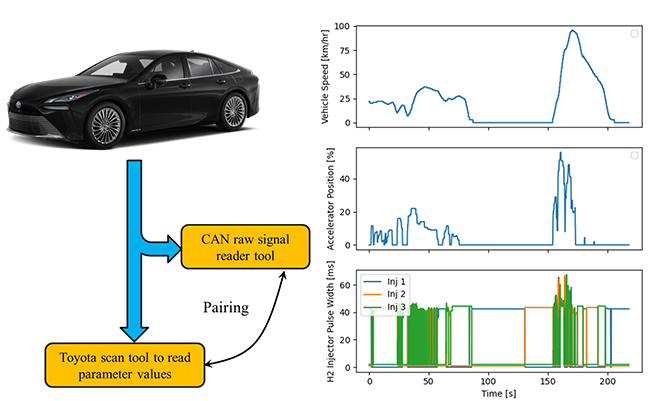
Figure 2: Left: CAN signal reverse engineering. Right: Example CAN signals.
Accomplishments
A 2021 Toyota Mirai was purchased, instrumented, and subjected to carefully designed road, chassis dynamometer, and thermal tests to collect data for analysis of system operation and performance in a range of conditions. The vehicle is powered by Toyota's state-of-the-art 128-kW humidifier-less free fuel cell system and has three hydrogen tanks (as shown in Figure 1 at the top). The key powertrain components were identified, and the powertrain's structure and instrumentation locations are shown in Figure 1 at the bottom.
Selected CAN signals were reverse-engineered by pairing the CAN parameters from the Toyota scan tool and the CAN raw message reader tool (as shown in Figure 2). Accessing the CAN signals significantly alleviated instrumentation requirements by providing information not readily accessible by deploying sensors.
The collected data enables the performance characterization of the Mirai fuel cell stack, as well as its accessories and power electronics. Additionally, it provides valuable insights into the underlying control strategy, in-situ transpiration for fuel cell membrane humidification, and a unique, detailed view of the cold start strategy, including accessory management and anode purging process. The transient duty cycle data provides clear measures for range and grade limitations. The thermal management system is tested by climbing steep gradients, allowing for insights into the effects of power derate.
SwRI engineers were able to develop a polarization curve of the Mirai fuel cell stack with data from a positive gradient cycle which is shown in Figure 3. This polarization curve will allow SwRI engineers to easily view characteristics specific to the Toyota Mirai cells. With this polarization curve a clear image can be seen of the effects of the three major cell losses: catalyst activation, ohmic & mass transport losses.

Figure 3: (Left) Toyota Mirai Gen II fuel cell polarization curve recorded by SwRI engineers. (Right) Theoretical fuel cell polarization curve showing regions polarization losses.
The fuel cell data illustrated in Figure 4 clearly shows the fuel cell power output is predominantly below 50 kW and the stack temperature is below 65°C for a vast majority of time across drive cycles. The average minimum cell voltage is also around 0.75 ~0.8 volts, indicating that the fuel cell is not subjected to any reactant starving or electrode flooding under 60 mph. There is a strong correlation between fuel cell stack temperature setpoint and power output as the temperature setpoint proportionately increases with required power output and is limited to 75°C.

Figure 4: Mirai stack performance and thermal data metrics showing ideal areas of stack operation across various duty cycles.